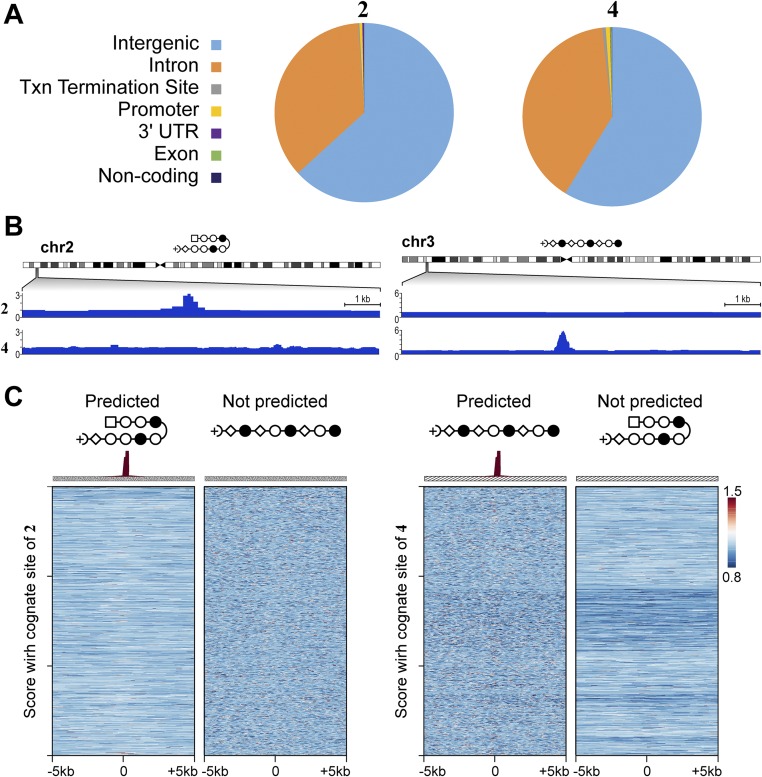
Fig. S8.
Comparison of the genome-wide distribution of 2 and 4 with functional elements. (A) Annotation of peaks across functional elements. Txn, transcription. (B) For each of the two loci in Fig. 3B, we show the signal track of the polyamide not predicted to be bound as a control. (C) Predictions based on scoring loci with a single cognate site do not show enrichment. Heat maps of COSMIC signal for 2 and 4. Here, we scored each locus for only its highest affinity consensus motifs 2 and 4. (Left) Tag density of each polyamide (normalized to input DNA and 107 tags) is shown for the top 1,000 nonoverlapping predicted hairpin loci. (Right) Tag density of each polyamide is shown for the top 1,000 nonoverlapping predicted linear loci.

