
Fig 3.
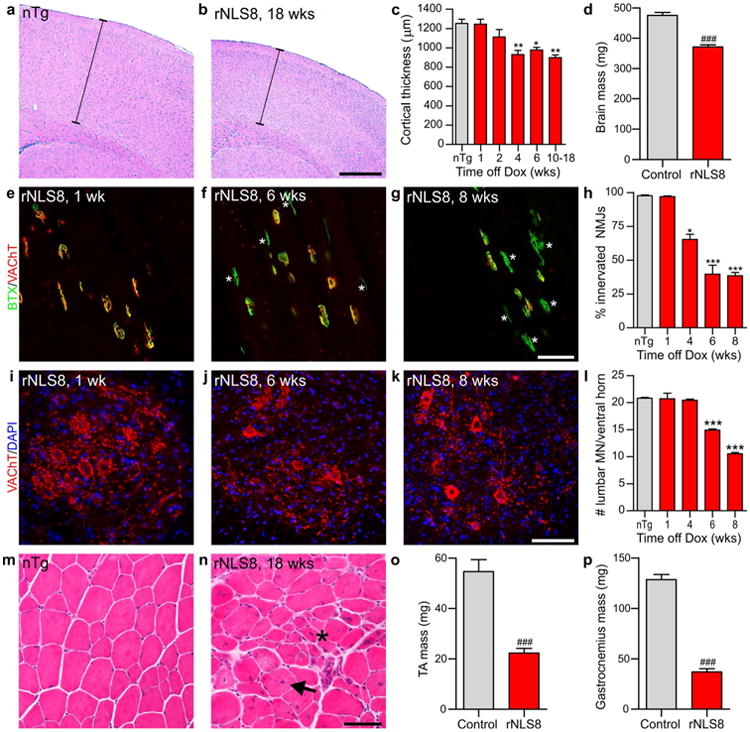
rNLS8 mice develop progressive cortical atrophy, muscle denervation, MN loss and muscle atrophy. a, b Representative brain sections from nTg and rNLS8 mice 18 weeks off Dox at Bregma 1.10, stained with haemotoxylin and eosin (H&E). Thickness is measured from the edge of the brain section to the white matter below (indicated with a bar). c Measurement of cortical thickness in nTg and rNLS8 mice at different ages, n = 3 per time point. d Brain mass of rNLS8 mice compared to littermate nTg or tTA monogenic controls at disease end stage of 10–18 weeks off Dox, n = 9 per group. e–h Representative images and quantification of the overlap of VAChT-positive motor terminals (red) with acetylcholine receptors stained using BTX (green) as an indicator of innervated motor endplates in the tibialis anterior (TA) muscle of rNLS8 mice. The TA muscle showed marked denervation at 6 and 8 weeks off Dox (f–g, vacated NMJs noted with asterisks), n = 4 mice per time point. i–k IF for MN marker VAChT (red) with nuclear marker DAPI (blue) revealed loss of MNs in the lumbar spinal cord at 6 and 8 weeks off Dox in rNLS8 mice. I Quantification of number of VAChT-positive lumbar MNs in rNLS8 mice at different times off Dox. n = 4 mice per time point. m, n H&E staining of TA muscle showed gross muscle atrophy in rNLS8 mice at disease end stage compared to littermate nTg control. Examples of central nuclei are shown by an arrow and atrophic fibers by an asterisk. o, p TA and gastrocnemius muscle masses of rNLS8 mice compared to littermate nTg or tTA monogenic controls at disease end stage of 10–18 weeks off Dox, n = 7 per group. Scale bars a, b 500 μm, e–g 50 μm, i–k, m–n 100 μm; *p < 0.05, **p < 0.01, ***p < 0.001 versus control by one-way ANOVA with Bonferroni's post hoc test; ###p < 0.001 by paired two-tailed t test