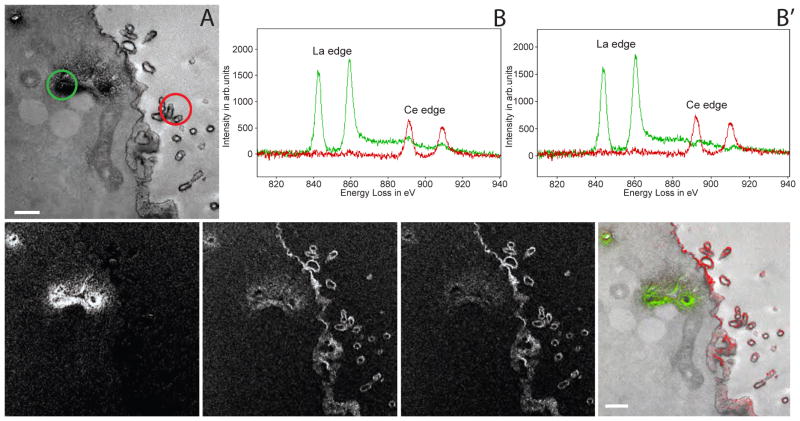
Figure 2. Two color EM of Golgi and plasma membrane in tissue culture cells.
(A) Conventional TEM image (x 6000, 1.4 nm/pixel) of MDCK cell following photooxidation with La-DAB2 by NBD ceramide-labeled Golgi and subsequent oxidation of Ce-DAB2 on plasma membrane (PM) with HRP-labeled antibody to EpCAM. (B) Spectra obtained at Golgi region (green spectra), and at PM containing EpCAM (red spectra); the respective regions are shown as circles in A. The Golgi region shows a strong La signal with weak Ce signal, the PM region shows only Ce. (B′) The cross-talk in the spectra shown in B, due to Ce-DAB2 attaching to regions labeled with La-DAB2 has been mathematically subtracted. (C) & (D) La and Ce elemental map obtained by the five-window method on the CCD (bin by four pixels), each energy window image was a sum of nine individual drift corrected images, each acquired for a 60 s exposure. A Gaussian smoothing of blur radius 1 was applied to the images. (D′) The Ce map shown in D, mathematically corrected to remove the cross-talk due to Ce-DAB2 attaching to regions labeled with La-DAB2. (E) Two color merge of the elemental maps (La in green and Ce in red), overlaid on the conventional TEM image.

