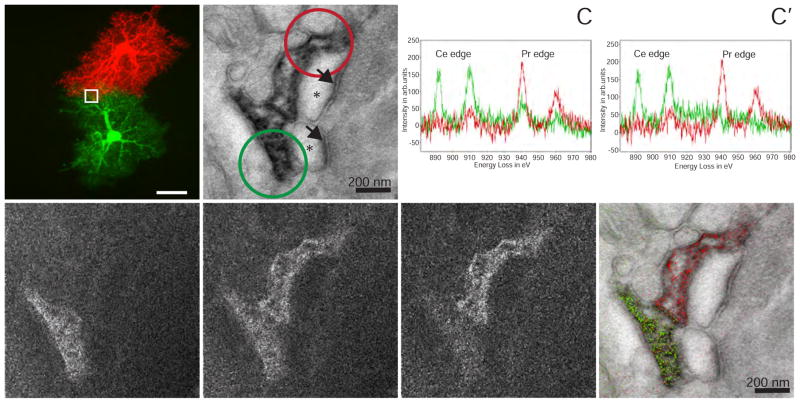
Figure 3. Two-color EM of hippocampal astrocytes in brain slices.
(A) Correlative fluorescent image of adjacent hippocampal astrocytes injected with Lucifer yellow or neurobiotin/Alexa 568. The white box is the approximate region of the EM acquisition, shown in the following panels. (B) Conventional TEM image (x 15000, 0.56 nm/pixel) showing astrocyte processes containing precipitated Ce- and Pr-DAB2 complexes contacting two spines synapsing (asterisk) with a bouton (PSDs indicated with arrows). (C) EELS spectra obtained at the lower astrocyte (green spectra) photooxidized with Ce-DAB2 and upper astrocyte (red spectra) HRP enzymatically reacted Pr-DAB2; the respective regions are shown as circles in B. The upper astrocyte contains predominately Pr, whereas the bottom has Pr and Ce signals. (C′) The cross-talk in the spectra shown in C, due to Pr-DAB2 attaching to regions labeled with Ce-DAB2 has been mathematically subtracted. (D) & (E) Ce and Pr elemental maps (x 25000; five window method using a sum of 19 drift-corrected 50 s exposures per window). (E′) Corrected Pr map, removing Pr-DAB from regions with Ce-DAB. (F) Two-color merge of the spectrally-separated elemental maps (green for Ce and red for Pr) overlaid on a conventional image, showing the two different astrocyte processes contacting the same synapse.

