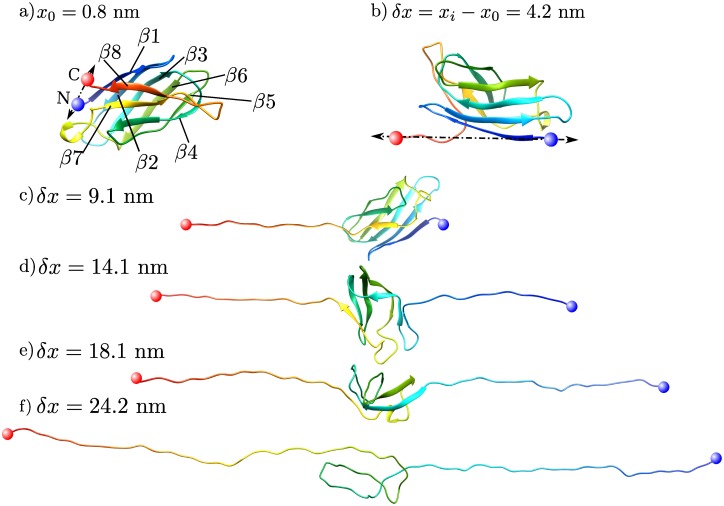
Fig 3. Snapshots of tSOD1 protein (PDB 4BCZ) in all-atom pulling simulations during the unfolding process.
The tether points at the N-C termini are shown in blue and red spheres respectively. Panel a) shows the initial configuration of the protein and panels b-f show the protein at different extensions. The colors reflect the residues’ positions (their index) and map to a rainbow color gradient where β1 and β8 are blue and red respectively. The reported distances δx = xi − x0 are the change in separation between the tethers, where x0 is the initial distance between tether points.

