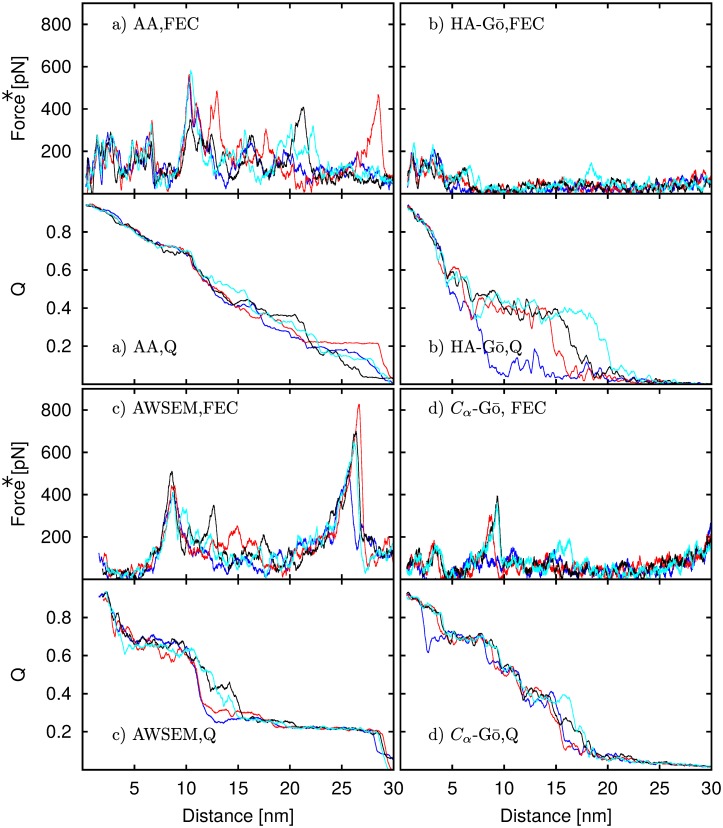
Fig 5. FECs and corresponding native Q curves for the a) All-atom, b) HA-Gō, c) AWSEM, and d) Cα-Gō models for four runs.
A high value of Q at small distances indicates that the protein is folded at the beginning of the pulling. As the protein is strained, Q decreases and finally approaches zero when the protein is fully extended. Each drop in the FEC corresponds to a drop in Q, indicating that the loss of native contacts releases the stress. Force* represent the rescaled force.

