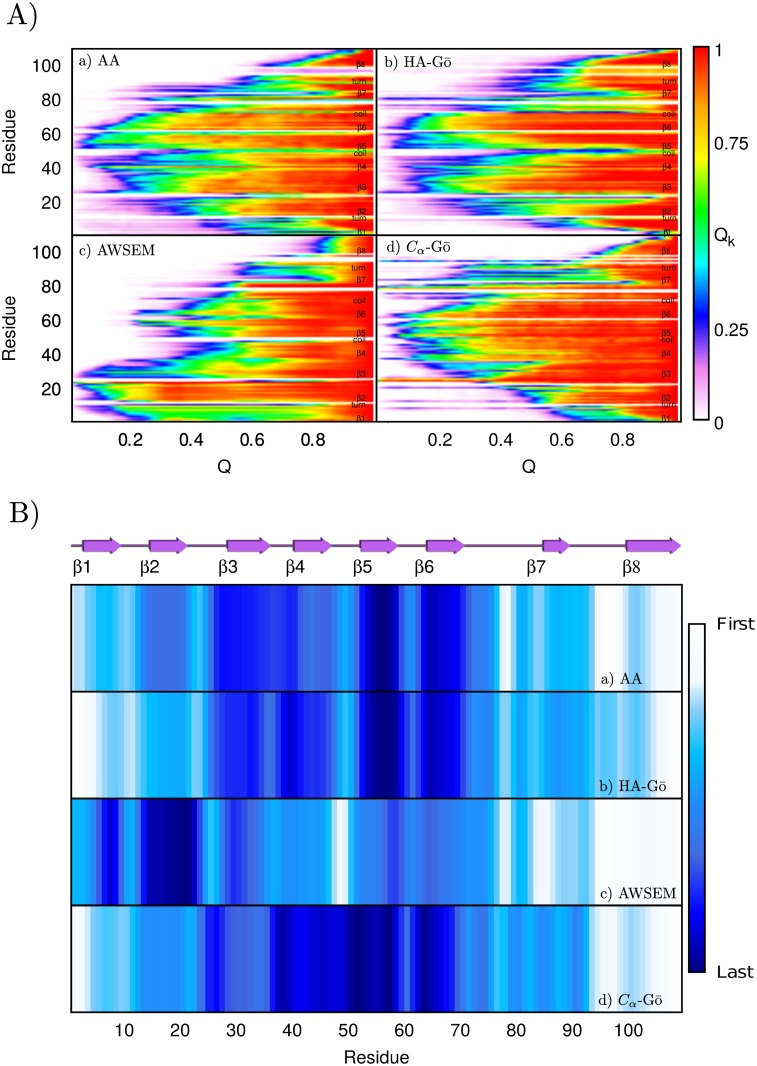
Fig 7.
A) Fraction of native contacts for each residue Qk(Q) vs. total number of native contacts (Q) a) All-atom, b) HA-Gō, c) AWSEM, and d) Cα-Gō. The color red shows the presence of all the native contacts and white represents a residue that shares no native contacts with the other residues in the protein. B) Another representation of the loss of native structure as the protein is mechanically unfolded. The color scheme represents which residue loses more than 50% of its contacts (Qk < 0.5) first in Q. The white color shows the least stable residues and the dark blue represents the most persistent residues.

