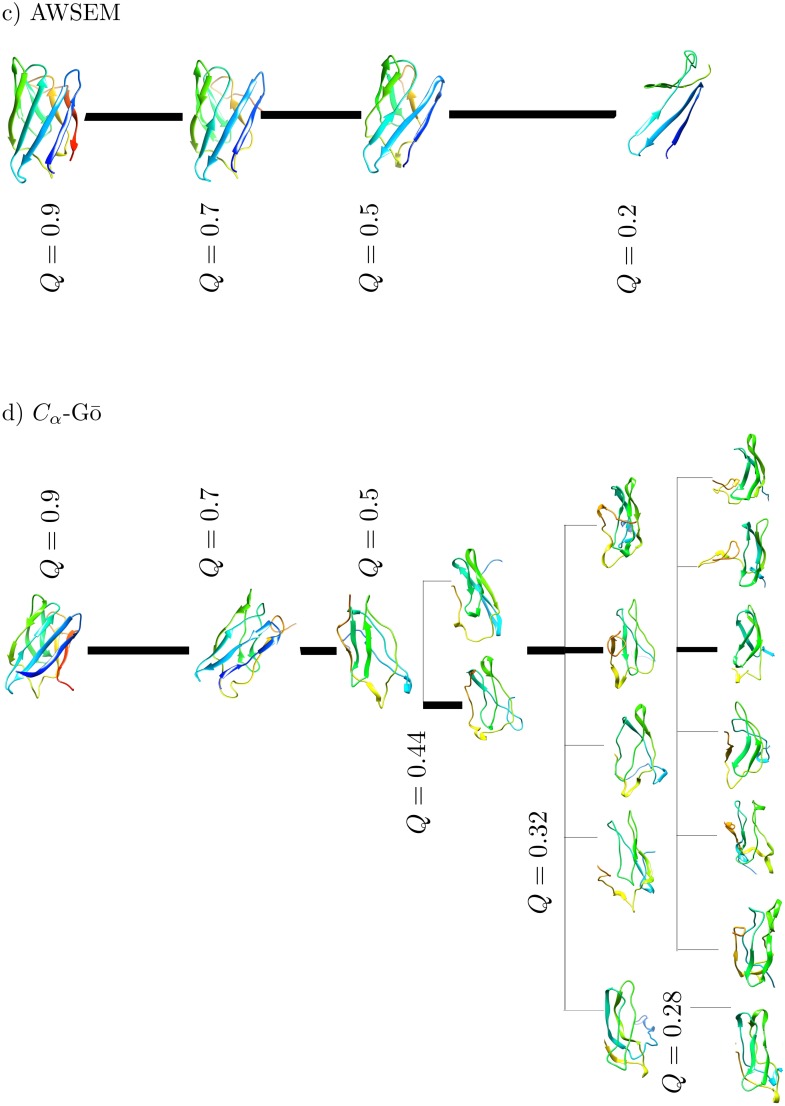
Fig 11. Cluster centroid conformations at different Q are shown for c) AWSEM, and d) Cα-Gō model.
The AWSEM model is characterized by only one unfolding pathway from Q = 0.9 − 0.24, in contrast to all-atom, HA-Gō and, Cα-Gō models. The Cα-Gō model has a single pathway of unfolding as long as Q > 0.44. The dominant pathway is shown with a thick black line. The thickness of the line is proportional to the fraction of total trajectories connecting the centroids in each cluster.

