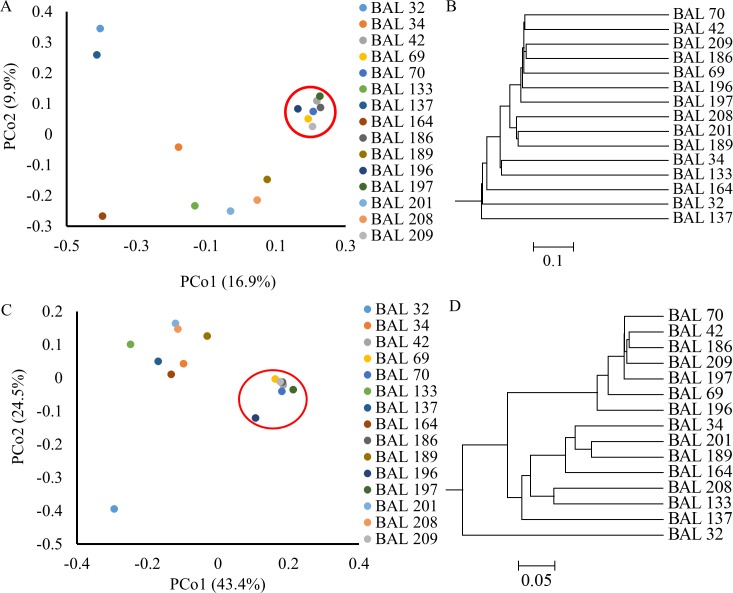
Fig 2. Distance Analyses of Culture Negative BAL Samples.
UniFrac analysis was used to analyze the phylogenetic distances between in communities in each BAL sample, this was visualized by unweighted (Fig 2A-B) and weighted (Fig 2C-D) Principles Coordinates Analysis (PCoA, Fig 2A and C) and a dendrogram trees (Fig 2B-C). Each PCoA axis (PCo1 or PCo2) describes the percentage of variation between samples that the axis is able to explain. Common samples that cluster together are circled in red.

