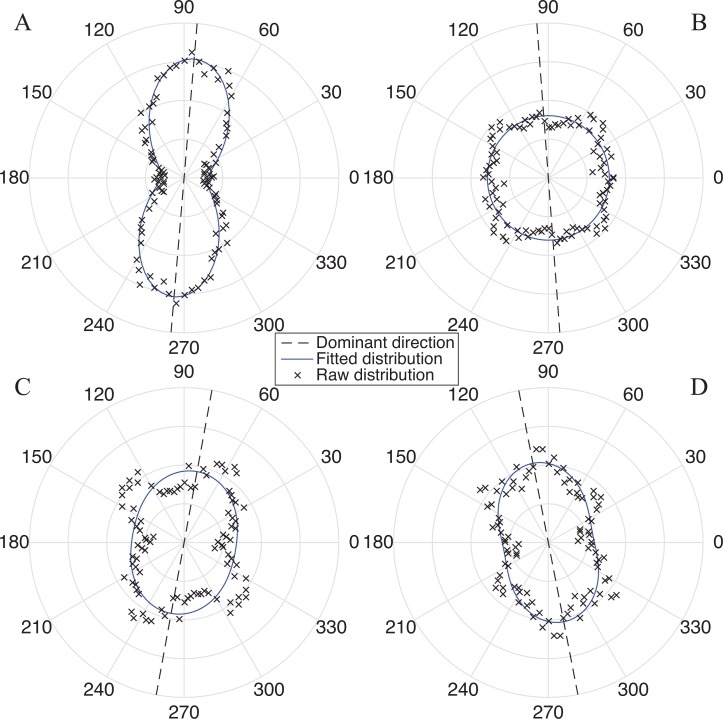
Fig 5. Representative fiber distributions found in the upper cervix and corresponding 2D von-Mises fits.
The dominant direction θ is shown by dotted line. All four subregions are taken from the outer radial zone of the same NP sample (Specimen 5 in Table 1). A subregion with (A) a single family of fibers that have the most alignment (b = 0.820) and (B) highly dispersed fibers that are randomly oriented in the plane. A subregion with (C) two fiber families and (D) three fiber families. (Note: current distribution fitting methodology cannot distinguish the multiple fiber families.)

