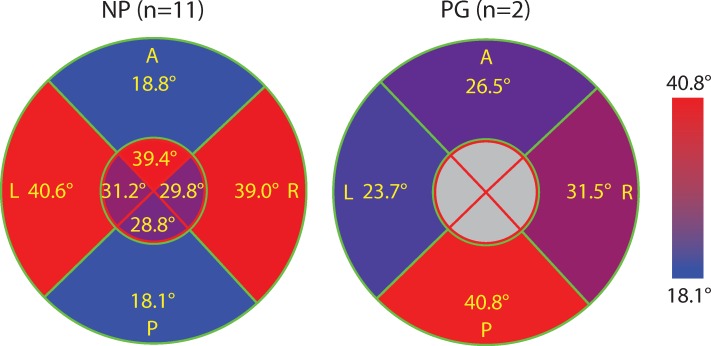
Fig 7. The average of the SD of dominant fiber direction θ between radial subregions for NP and PG specimens.
Values are shown in eight regions that include the inner and outer radial zones of four quadrants. Each region is color-coded such that red represents higher SD (more heterogeneous θ between radial subregions) and blue represents lower SD (more homogeneous θ between radial subregions). The anterior and posterior quadrants of the NP cervical tissue samples have more homogeneous circumferential fibers compared to its left and right quadrants.

