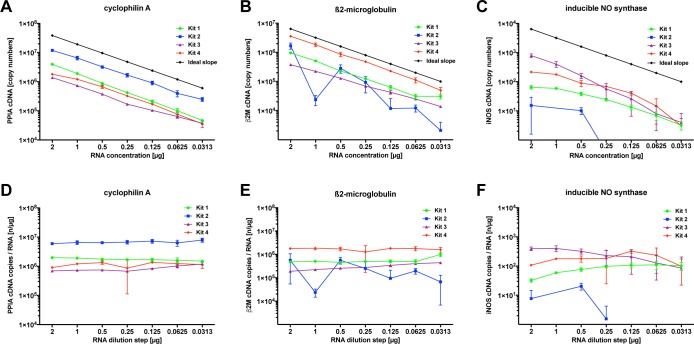
Fig 2. Influence of kit selection on linearity and efficacy of cDNA synthesis.
The figure depicts absolute cDNA copy numbers after reverse transcription of one mRNA dilution series (pooled from mRNA of six naïve animals) with four different cDNA synthesis kits and RT-qPCR for the housekeeping genes ß2M and PPIA and the low-copy, regulated gene iNOS. All four kits show a linear correlation between the mRNA concentration and the cDNA output for ß2M and PPIA (Spearman's rank-order correlation coefficient; r2>0.99), except at a ß2M mRNA concentration of 1μg. Only kit 3 shows a strong linear correlation between iNOS cDNA and mRNA (r2>0.99; c). The mRNA/cDNA ratio varies significantly between the individual kits and the genes, although the individual kits show a certain consistency regarding the single gene dilution series (d-f). All plots show mean ± S.D.

