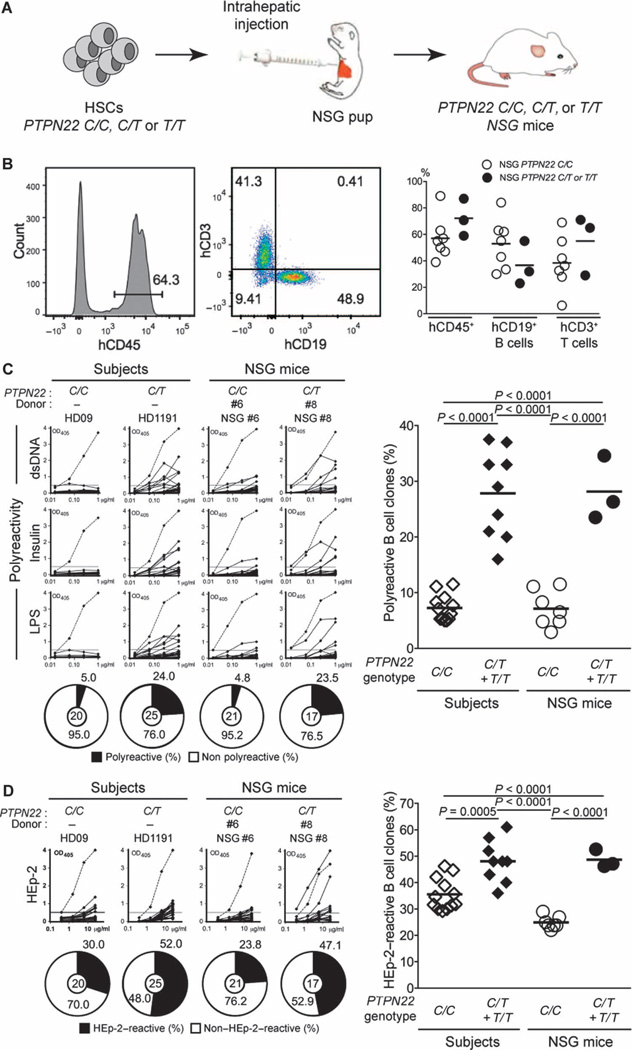
Fig. 1. Defective central B cell tolerance in humanized mouse engrafted with HSCs carrying PTPN22 T allele(s).
(A) Schematic diagram depicting the generation of humanized mice. CD34+ HSCs that carry (or do not carry) PTPN22 T allele(s) were injected into the liver of 3-day-old recipient NSG mice. (B) Representative flow cytometry analysis of the frequency of human (h) CD45+, CD3+, and CD19+ cells in the blood of the indicated recipient mice. The summary of blood engraftment from NSG mice transplanted with PTPN22 C/C, C/T, or T/T HSCs is represented. Each dot represents an individual mouse, and the bars indicate mean values. The frequencies of polyreactive (C) and HEp-2–reactive (D) new emigrant B cells from different types of humanized mice transplanted with indicated HSCs were determined and compared with those of healthy donors that carry (or do not carry) PTPN22 T allele(s). Dotted lines show positive control. For each B cell fraction, the frequency of reactive (solid area) and nonreactive (open area) clones is summarized in pie charts, with the total number of clones tested indicated in the center. In summarized reactivity panels on the right, each diamond represents an individual, and each dot represents a mouse. Averages are shown with a bar, and statistically significant differences are indicated. OD, optical density.

