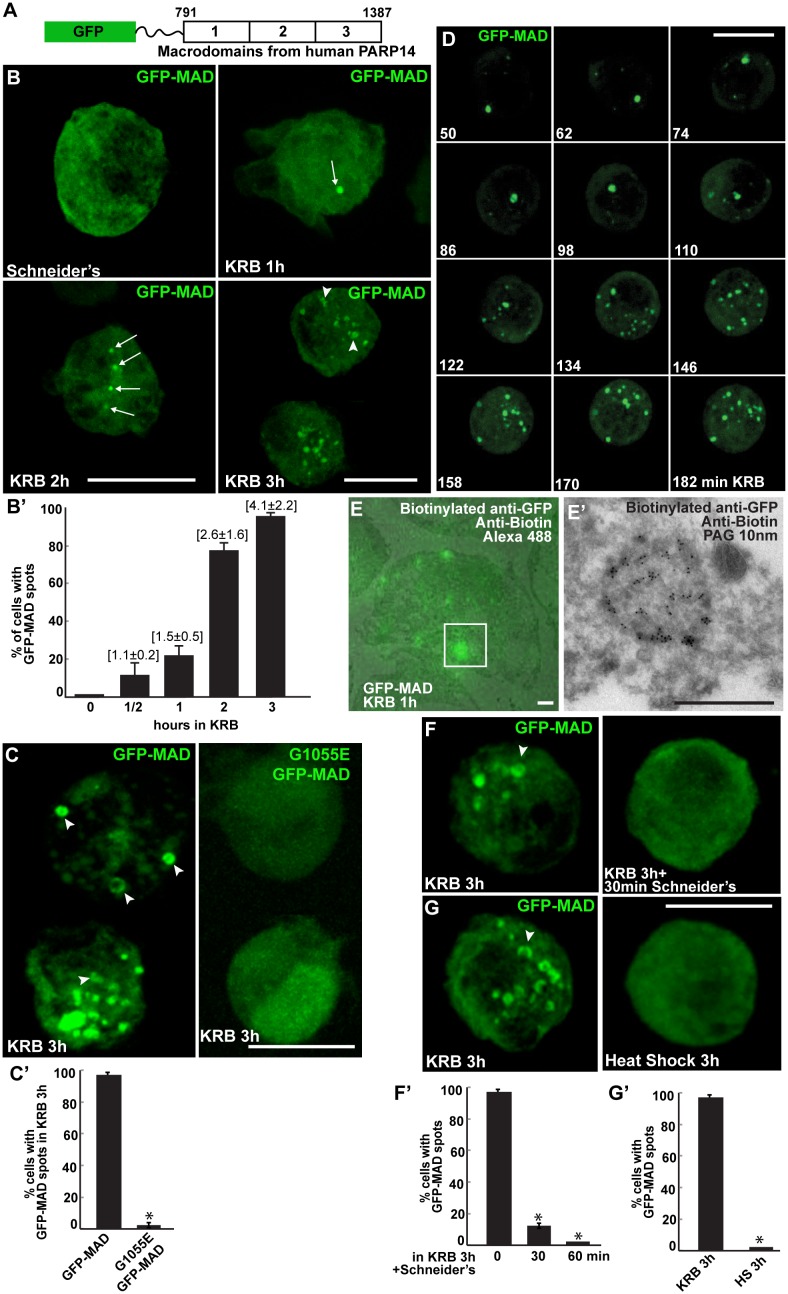
Figure 2. Amino-acid starvation leads to the formation of MARylation spots visualised with GFP-MAD.
(A) Schematics of the GFP-MAD probe. (B, B’) Fluorescence of GFP-MAD in growing S2 cells (Schneider’s) and upon amino-acid starvation (KRB) for increasing amount of time as indicated (B). Note the formation of GFP-MAD spots (arrows) (some in an U-shape, arrowheads in B-D). The % of cells at each time point displaying GFP-MAD spots is shown in B’. The average number of spots per cell is indicated above each bar. (C, C’) Fluorescence of GFP-MAD and G1055E GFP-MAD probe (that does not bind mono-ADP-ribose in vitro). Note that the mutant probe does not form spots in KRB (quantified in C’). (D) Stills of a time-lapse movie (Video 1) of GFP-MAD in cells incubated in KRB for 3 hr. The first frame is taken after 50 min incubation. The subsequent frames are taken every 12 min. (E, E’) Correlative Fluorescence/IEM of GFP-MAD spots in S2 cells upon amino-acid starvation (KRB, 1 hr). The IEM (E’) corresponds to the white rectangle in fluorescence that is overlapped with the corresponding electron micrograph (E). (F, F’) Fluorescence pattern of GFP-MAD and endogenous Sec16 (red) in KRB and in KRB followed by incubation with Schneider’s for 30 min. Note that GFP-MAD pattern is completely reverted (quantified in F’). (G, G’) Fluorescence pattern of GFP-MAD in KRB and upon heat shock (3 hr at 37°C). Scale bars: 10 μm (B, C, D, F, G); 500 nm (E, E’). Error bars: SEM.


