. 2016 Nov 29;5:e17126. doi: 10.7554/eLife.17126

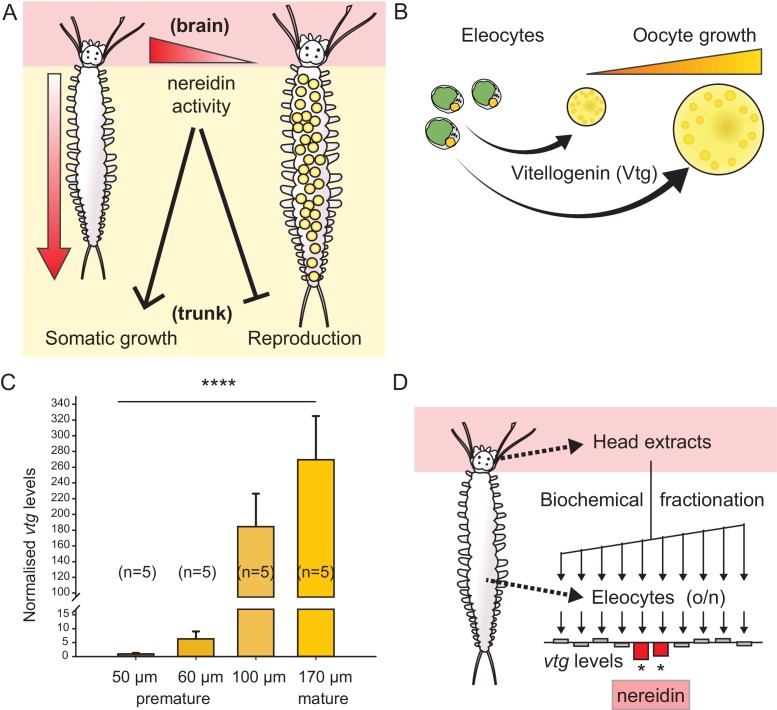
Figure 1. Vitellogenin expression in eleocytes is a quantitative measure for the maturation stage of Platynereis, allowing for the establishment of a bioassay to purify the enigmatic brain hormone, nereidin.

(A) Scheme summarising the critical role of the brain hormone nereidin in energy expenditure, as derived from classical experiments: Before maturation (left), high nereidin levels sustain somatic growth, but repress reproduction; drops in nereidin activity levels initiate the generation of germ cells and sexual maturation (right). (B) Eleocytes in the worm’s coelom have a central role in reproductive commitment, as they synthesise the yolk protein precursor Vitellogenin (Vtg); after release into the coelomic fluid, Vtg is endocytosed by the developing oocytes, leading to oocyte growth. (C) Expression levels of vtg in eleocytes are significantly up-regulated during maturation, confirming vtg as a suitable molecular marker to quantify maturation state. qRT-PCR quantification of vtg levels in eleocytes sampled at different stages of sexual maturation (as assessed by oocyte diameter). The increase in vtg transcripts from premature eleocytes (oocyte diameter: 50 and 60 µm) to those from mature eleocytes (oocytes diameter: 170 µm) is evident; expression levels were calculated against the arithmetic mean of the reference genes cdc5 and rps9, and normalised to the expression of vtg in eleocytes from animals with an oocyte diameter of 50 µm. Statistical significance was tested an one-way ANOVA. ***p<0.001. n: number of biological replicates. (D) Resulting bioassay for the purification of nereidin from head extracts: primary cell cultures were derived from coelomic cells of premature animals; vtg levels were quantified after overnight incubation with different fractions of head extract to determine those fractions containing significant inhibitory activity (nereidin). Data for panel (C) provided in Figure 1—source data 1.

DOI: http://dx.doi.org/10.7554/eLife.17126.003

Figure 1—source data 1. Data for the graphs in Figure 1C, Figure 1—figure supplement 2A, Figure 1—figure supplement 2B (vtg expression levels over the time course of maturation).
DOI: 10.7554/eLife.17126.004
Figure 1—source data 2. Alignment file for the phylogenetic tree of Vitellogenins (Figure 1—figure supplement 1B).
DOI: 10.7554/eLife.17126.005

Figure 1.

Figure 1—figure supplement 1. Identification of a Platynereis Vitellogenin orthologue.

Figure 1—figure supplement 1.

(A) Domain analysis for the protein encoded by the identified Platynereis cDNA (top) as well as chicken Vtg2 (middle) and mosquito Vit1 (bottom) reveals that Platynereis Vtg shares three conserved domains with other bilaterian Vitellogenins that are arranged in the same order: a Lipoprotein N-terminal Domain (LPD-N, SMART accession SM000638, blue), a DUF1943 domain (DUF, SMART accession SM001169, green), and a van Willebrand factor D domain (VW, SMART accession SM000216, red). (B) Molecular phylogenetic analysis supports the orthology of Platynereis Vtg with representatives of other invertebrate and vertebrate Vitellogenins. Maximum likelihood tree constructed with IQtree 1.3.12 (Minh et al., 2013; Nguyen et al., 2015), using apolipophorins as an outgroup. By parameter optimisation, the LG+F+I+G4 substitution model was selected. Numbers at each node show confidence levels derived from 1000 replicates. Sequences accessions: Gallus Vtg2: NP_001026447.1; Xenopus VtgA2: P18709.1; Apis Vit1: Q868N5.1; Aedes Vit1: Q16927.2; Capitella Vtg: ELU00944.1; Haliotis Vtg: BAF98238.1; Platynereis Vtg: KU756287 (this study); Pecten Vtg: CAQ06469.2; Crassotrea Vtg: EKC30345.1; Xenopus ApoB: XP_002934538.2; Gallus ApoB: NP_001038098.1; Crassotrea ApoLp: EKC20363.1; Drosophila ApoLp: Q7KTG2; Aedes ApoLp: Q17BE3. Alignment file for panel (B) provided as Figure 1—source data 2.

Figure 1—figure supplement 2. Irrespective of the chosen reference gene, vitellogenin is regulated over the course of maturation.
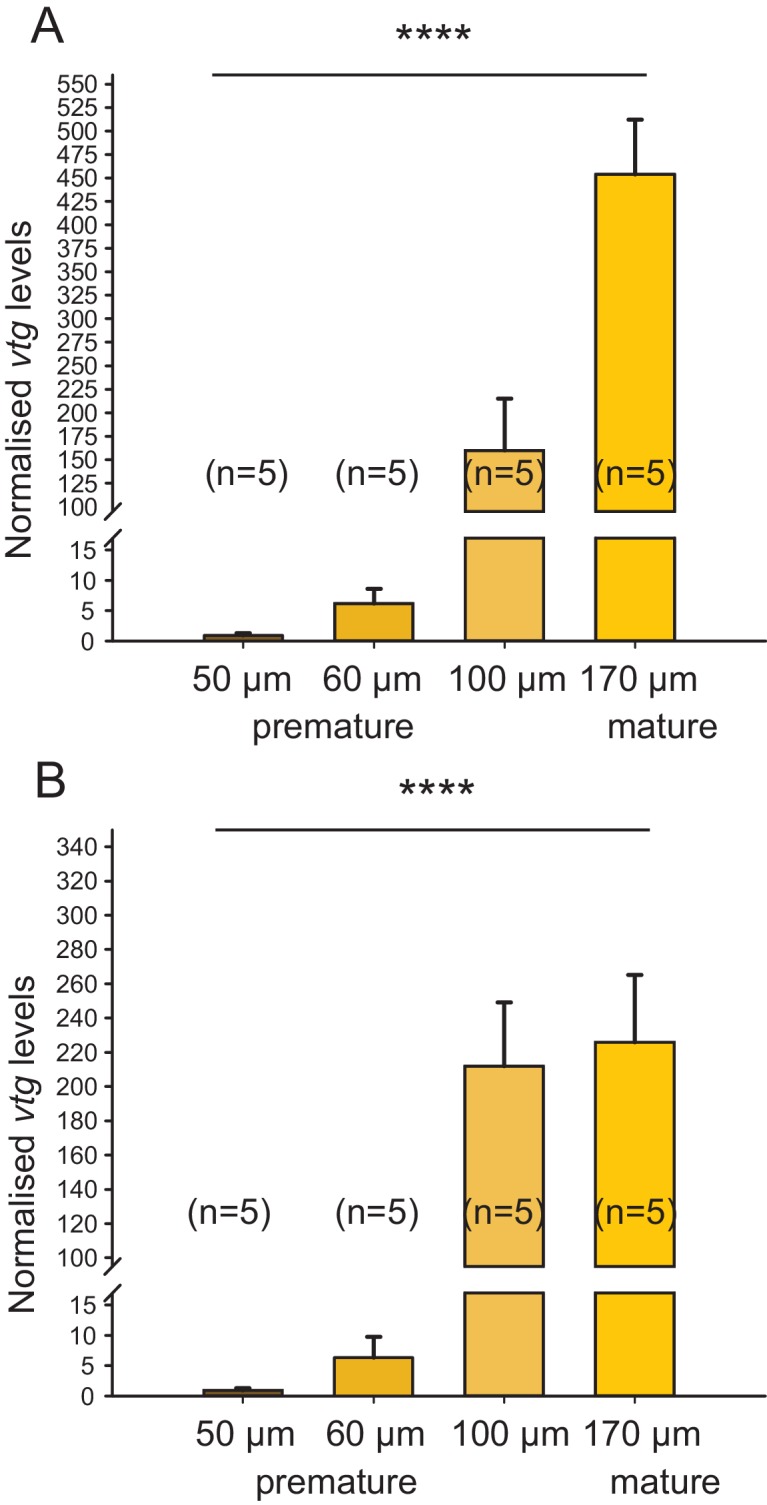
Figure 1—figure supplement 2.

The figure shows the same data as Figure 1C, but with the results for the individual reference genes plotted separately. In the range relevant for the bioassay (early premature stage), the observed relative expression of vitellogenin (vtg) in eleocytes is independent of the reference gene used for normalisation; differences in levels close to spawning are likely caused by the divergent role of rps9 and cdc5 in protein translation and the cell cycle, respectively. (A) rps9 used as reference gene for normalisation. The vtg expression levels relative to the expression in eleocytes from animals with an oocyte diameter of 50 µm were 6.20, 159.81 and 453.86 for eleocytes from animals with oocyte diameters of 60, 100 and 170 µm, respectively. (B) cdc5 used as reference gene for normalisation. The vtg expression levels relative to the expression in eleocytes from animals with an oocyte diameter of 50 µm were 6.36, 212.01 and 225.80 for eleocytes from animals with oocyte diameters of 60, 100 and 170 µm, respectively. Statistical test as in Figure 1C. ****p<0.0001. Data for panels (A) and (B) provided in Figure 1—source data 1.