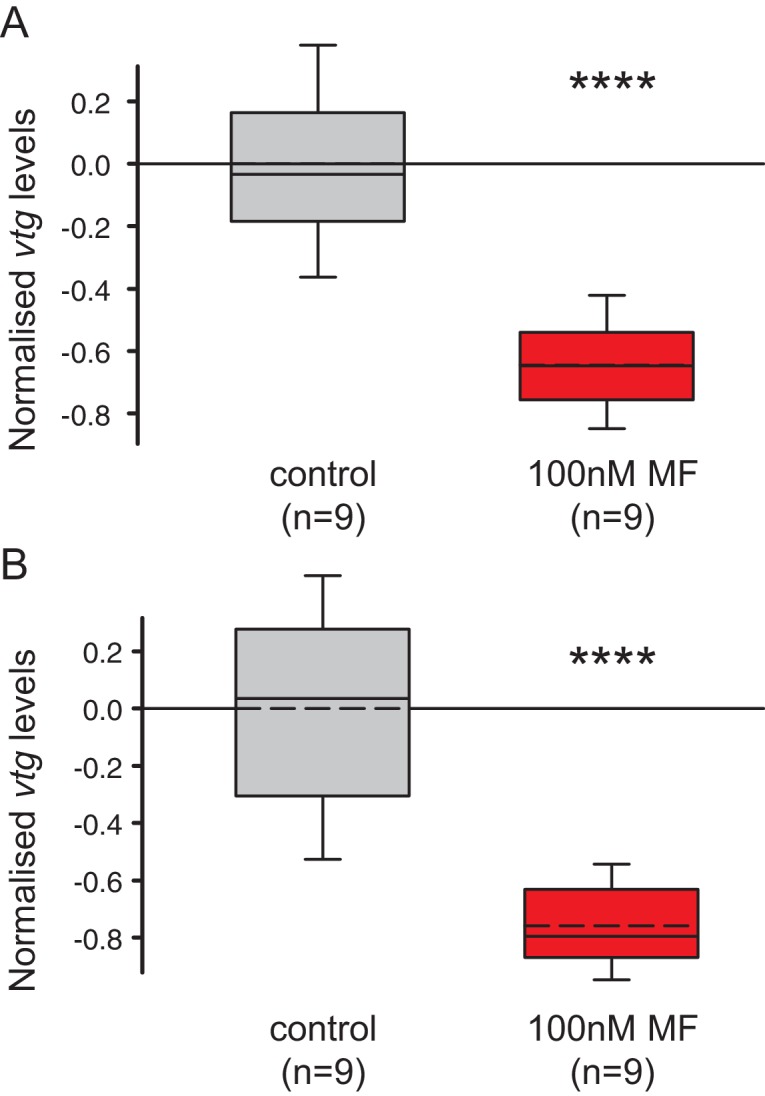
Figure 4. MF also represses vtg expression in vivo, and sustains expression of a marker for caudal growth upon posterior amputation.
(A) Setup of experiment testing the ability of MF to interfere with vitellogenesis in vivo. Following decapitation, female individuals are known to start vitellogenesis, reflecting loss of nereidin; treatment with MF tests if the repressive effect of nereidin on vtg observed in primary cultures of coelomic cells also occurs in the normal context of these cells. (B) qRT-PCR analysis of vtg expression in decapitated animals 5 days after decapitation. The animals were either treated with 0.1% DMSO (control) or in 100 nM MF in 0.1% DMSO for five days. Expression levels of vtg upon presence of MF are ~70% lower than in treated animals. vtg levels were related to the arithmetical mean of the reference genes rps9 and sams and normalised to the vtg-expression level of the control. (C) MF sustains expression of hox3, a marker diagnostic for caudal regeneration. qRT-PCR analysis of hox3 expression in Platynereis fragments 5 days after posterior amputation. Headless worm fragments treated with 100 nM MF in 0.1% DMSO (right) show twice as high levels of hox3 than headless control fragments (left) only treated with 0.1% DMSO. Hox3-expression is relative to that of the arithmetical mean of the reference genes rps9 and sams and normalised to the hox3-expression level of the untreated samples. (B,C) Boxplots show the first and third quartile, the median (solid line), and the mean (dashed line). Whiskers denote the 10th and 90th percentile. Statistical significance was tested by a one-sided (B) and a two-sided t-test (C), respectively. *p<0.05. ****p<0.0001. n: number of biological replicates. Raw data for panels B,C provided in Figure 4—source data 1.
DOI: http://dx.doi.org/10.7554/eLife.17126.019

Figure 4—figure supplement 1. The choice of reference genes does not impact on the observed down-regulation of vtg.