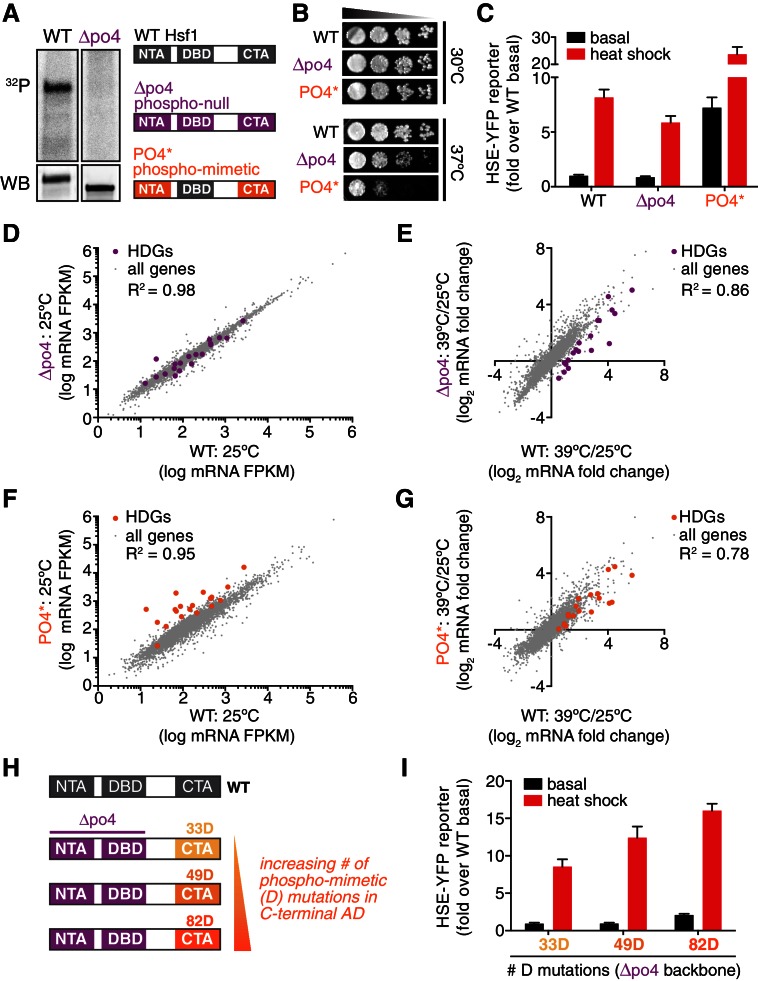
Figure 4. Phosphorylation is dispensable for Hsf1 function but tunes the gain of its transcriptional activity.
(A) 32P incorporated into wild type Hsf1-3xFLAG-V5 and Hsf1∆po4-3xFLAG-V5 during 30 min of heat shock (upper panel). Hsf1-3xFLAG-V5 and Hsf1∆po4-3xFLAG-V5 were affinity purified by anti-FLAG IP, resolved by SDS-PAGE and phosphor-imaged. Western blot of total lysate from wild type Hsf1-FLAG-V5 and Hsf1∆po4-FLAG-V5 cells was probed with an anti-FLAG antibody; Hsf1∆po4-FLAG migrates faster than wild type Hsf1-FLAG (lower panel). Schematics of the domain architecture and color code for wild type Hsf1, Hsf1∆po4 and Hsf1PO4*. (B) Wild type, Hsf1∆po4 and Hsf1PO4* cells were monitored for growth by dilution series spot assays. Cells were incubated at the indicated temperatures for two days. (C) Wild type, Hsf1∆po4 and Hsf1PO4* cells expressing the HSE-YFP reporter were assayed for Hsf1 transcriptional activity in control and heat shock conditions by flow cytometry. Bars are the average of median YFP values for three biological replicates, and error bars are the standard deviation. See Materials and methods for assay and analysis details. (D) Genome-wide mRNA levels were quantified in basal conditions in wild type and Hsf1∆po4 cells by RNA-seq. Within each sample, relative expression levels for each mRNA (gray dots) are plotted as fragments per kilobase per million mapped reads (FPKM). Hsf1-dependent genes (HDGs) are highlighted in purple. Source data are included as Figure 4—source data 2. (E) Fold changes of each mRNA in heat shock conditions compared to basal conditions were calculated for wild type and Hsf1∆po4 cells and plotted against each other. Hsf1-dependent genes (HDGs) are highlighted in purple. Source data are included as Figure 4—source data 2. (F) Genome-wide mRNA levels were quantified in basal conditions in wild type and Hsf1PO4* cells by RNA-seq (gray dots). Hsf1-dependent genes (HDGs) are highlighted in orange. Source data are included as Figure 4—source data 2. (G) Fold changes of each mRNA in heat shock conditions compared to basal conditions were calculated for wild type and Hsf1PO4* cells and plotted against each other. Hsf1-dependent genes (HDGs) are highlighted in orange. Source data are included as Figure 4—source data 2. (H) Schematic of mutants with different numbers of aspartate (D) residues. 33, 49 or 82 D residues were introduced in the CTA in the ∆po4 background. (I) Mutants depicted in (H) expressing the HSE-YFP reporter were assayed for Hsf1 transcriptional activity in control and heat shock conditions by flow cytometry as above.
DOI: http://dx.doi.org/10.7554/eLife.18638.013


