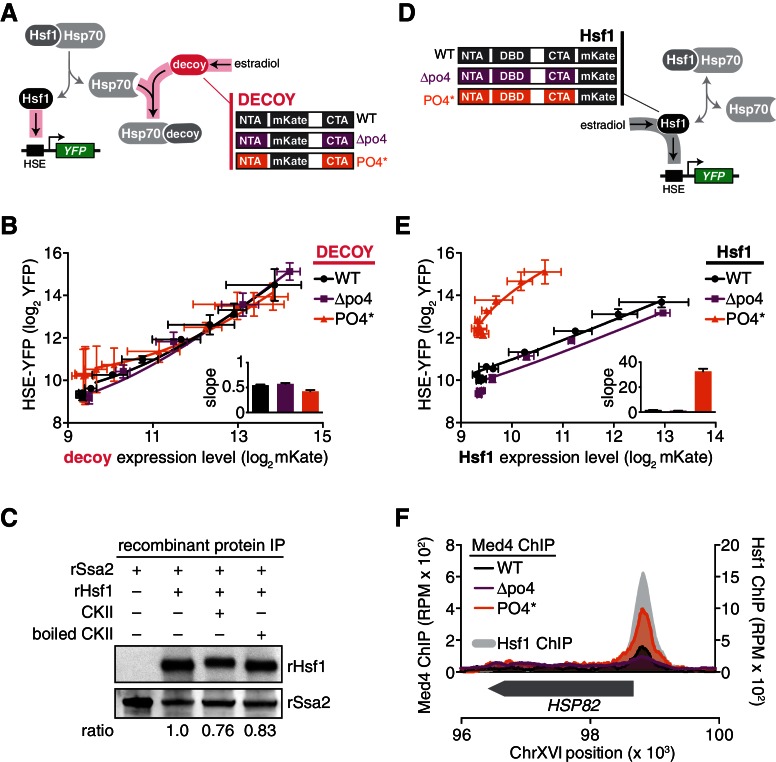
Figure 5. Hsp70 binding and phosphorylation are uncoupled Hsf1 regulatory mechanisms.
(A) Schematic cartoon of decoy constructs based on wild type Hsf1 (WT, black), Hsf1∆po4 (∆po4, purple) and Hsf1PO4* (PO4*, orange). The various decoys will activate endogenous Hsf1 in proportion to their affinity for Hsp70. (B) Measurement of the HSE-YFP reporter by flow cytometry in cells expressing decoy constructs derived from wild type Hsf1, Hsf1∆po4 or Hsf1PO4* as a function of the expression level of each decoy (mKate fluorescence). Data points are the average of median YFP and mKate values for three biological replicates, and error bars are the standard deviation. See Materials and methods for assay and analysis details. The slope of the input-output curves are plotted (inset). (C) IPs of recombinant proteins were performed with 3xFLAG-rSsa2 as bait and analyzed by Western blot. rHsf1 was pre-incubated with ATP alone or in the presence of ATP and either active casein kinase II (CKII) or boiled CKII. Blots were probed with an anti-FLAG antibody to recognize recombinant rSsa2 (top) and with an anti-HIS antibody to recognize recombinant rHsf1 (bottom). The numbers below the blots indicate the normalized ratio of Hsf1/Ssa2. (D) Schematic cartoon of full-length overexpression constructs for wild type Hsf1 (WT, black), Hsf1∆po4 (∆po4, purple) and Hsf1PO4* (PO4*, orange), each with mKate2 fused to its C-terminus. The full-length constructs will activate the HSE-YFP reporter in proportion to their transcriptional activity. (E) Measurement of the HSE-YFP reporter by flow cytometry in cells expressing full length constructs of wild type Hsf1, Hsf1∆po4 or Hsf1PO4* tagged at their C-termini with mKate2 as a function of expression level as in B. (F) ChIP-seq for Med4-3xFLAG-V5, a component of the Mediator complex, in basal conditions in wild type Hsf1, Hsf1∆po4, and Hsf1PO4* cells at the HSP82 locus. Wild type Hsf1-3xFLAG-V5 ChIP-seq was also performed in basal conditions (gray filled curve). See Figure 5—figure supplement 1 for more loci.


