. 2016 Nov 15;5:e18489. doi: 10.7554/eLife.18489

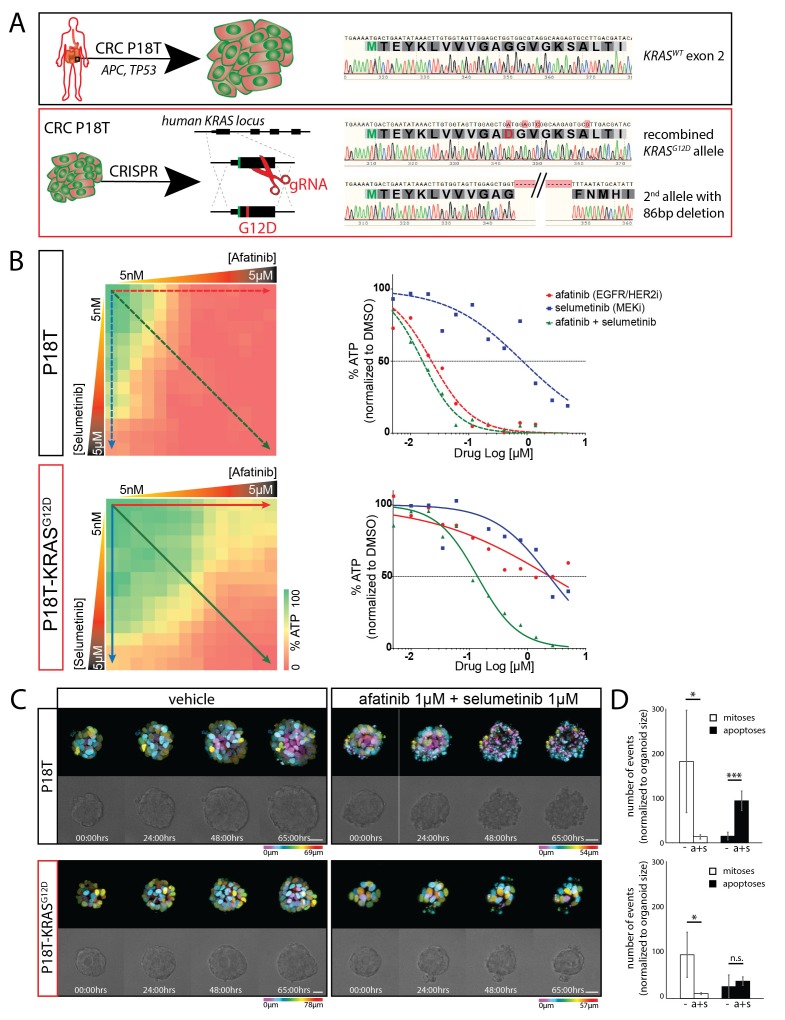
Figure 3. CRISPR genome editing in CRC organoids reveals effect of KRASG12D on drug response .

(A) Schematic representation of the CRISPR/Cas9-induced homologous recombination strategy to introduce the KRASG12D mutation in the KRASWT patient-derived CRC organoid P18T. Green bar: start codon. Red bar: G12D mutation. Parental and mutant sequences are shown on the right. (B) Extensive dual-inhibitor dose-response assay of patient-derived CRC organoids P18T and P18T-KRASG12D treated for 72 hr. 14×14 drug concentrations of afatinib and selumetinib were chosen with logarithmic intervals covering a 5 nM–5 μM range. The results of the full matrix screen are represented as a heat map (left), where red represents 0% ATP levels (no viability) and green represents 100% ATP levels (max viability). The dose-response curves to the right represent the horizontal (afatinib monotherapy), vertical (selumetinib monotherapy) and diagonal (afatinib/selumetinib combination therapy) lines in the heat maps. Dashed lines are P18T; solid lines are P18T-KRASG12D. (C) Stills from representative time-lapse imaging (three days) of CRC organoids P18T and P18T-KRASG12D treated with vehicle (DMSO) or afatinib + selumetinib (both 1 µM) (see also Video 1). In every panel, upper images show color-coded depth of maximum-projected z-stacks of H2B-mNeonGreen fluorescent organoids. Lower panels: corresponding transmitted light images. Time interval: 15 min. Scale bars: 20 µm. Representative time-lapse of 2 (total eight organoids/condition) and four experiments (total 20 organoids/condition) for P18T and P18T-KRASG12D resp. (D) Mitotic and apoptotic events in the organoid drug response movies (C and Video 1) were manually marked and quantified (see Materials and methods and Figure 3—figure supplement 3). In comparison with vehicle (-), drug treatment of p18T with afatinib and selumetinib (a+s) results in both proliferation block and apoptosis induction, while p18T-KRASG12D only shows reduced proliferation but unchanged apoptosis rates. Error bars represent standard deviation. *p<0,05; ***p<0,001; n.s. = not significant (p=0,4)

DOI: http://dx.doi.org/10.7554/eLife.18489.010

Figure 3.

Figure 3—figure supplement 1. Original heat map of viability and heat map of calculated scores for p18T and p18T-KRASG12D.

Figure 3—figure supplement 1.

Positive Bliss scores (red hues) indicate combinations where the effect is greater than expected based on additive effects.
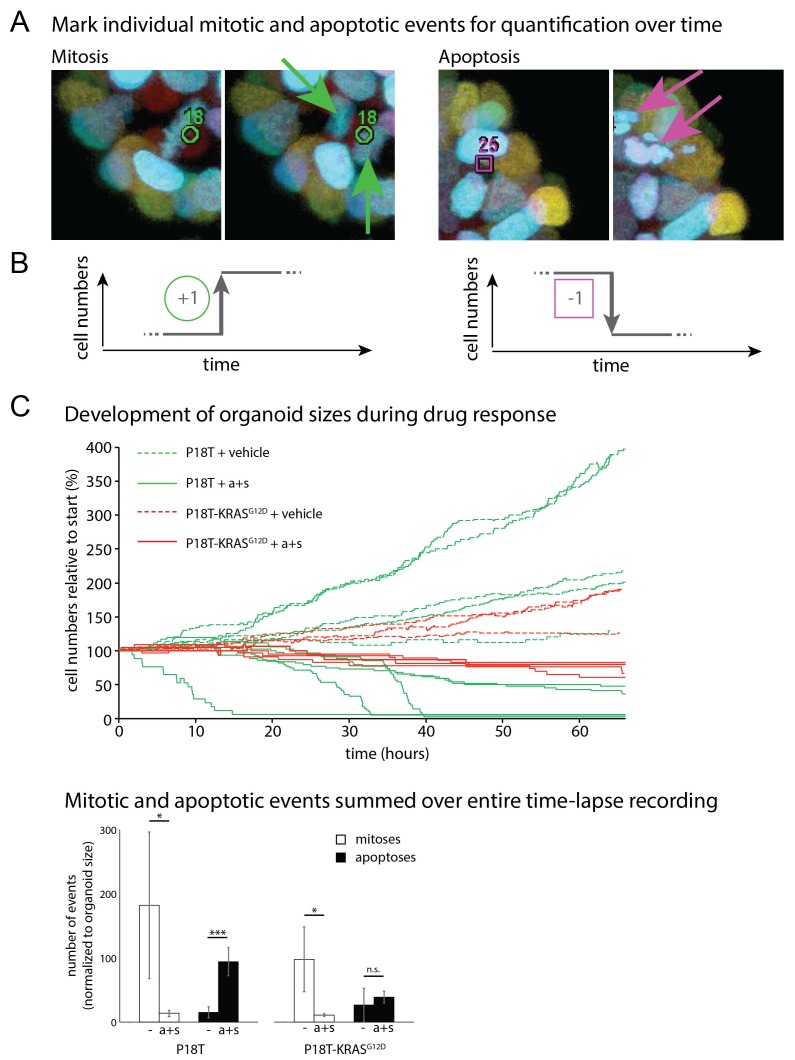
Figure 3—figure supplement 2. Quantifying life and death during real-time imaging of drug response.

Figure 3—figure supplement 2.

(A) Time-lapse XYZT acquisitions were visualized using color-coded depth projections and mitotic and apoptotic analysis were manually marked. (B) Increases (mitoses) and decreases (apoptosis) in cell numbers were chronologically ranked, thus reconstructing organoid size evolution in time. (C) Separate contributions of mitoses and apoptosis to development of P18T and P18T-KRASG12D while incubated with vehicle (−) or afatinib + selumetinib (a+s). Whereas in P18T drug treatment (a+s) results in both proliferation block and apoptosis induction, P18T-KRASG12D only show reduced proliferation but unchanged apoptosis rates. *p<0,05; ***p<0,001; n.s. = not significant (p=0,4)
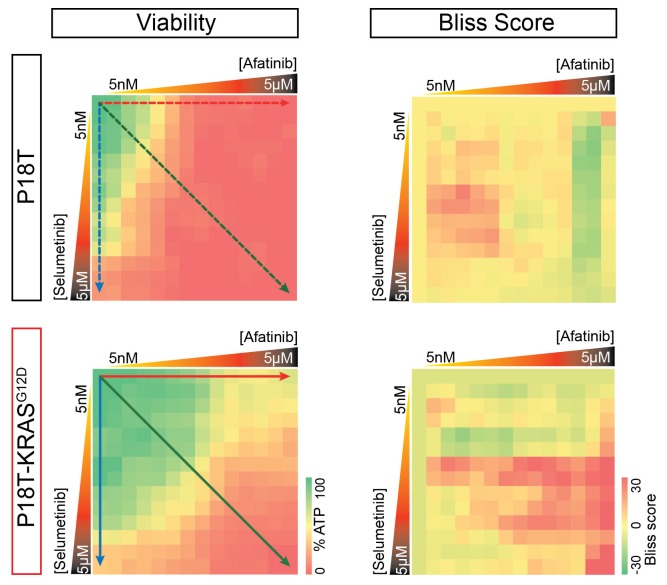
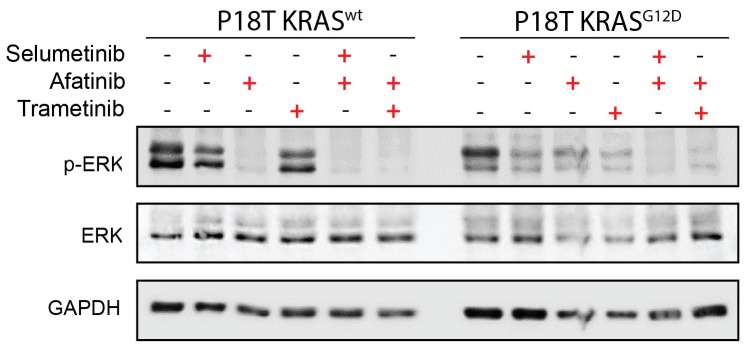
Figure 3—figure supplement 3. Drug response of CRC organoids as examined by Western blot.

Figure 3—figure supplement 3.

Combined Pan-HER/ MEK inhibition results in reduction of ERK phosphorylation in KRASWT and KRASG12D CRC organoids. Organoids were treated for 24 hr with MEK inhibitors selumetinib (1 μM), trametinib (10 nM), and the pan-HER inhibitor afatinib (1 μM) as indicated. WB is representative of four independent experiments.
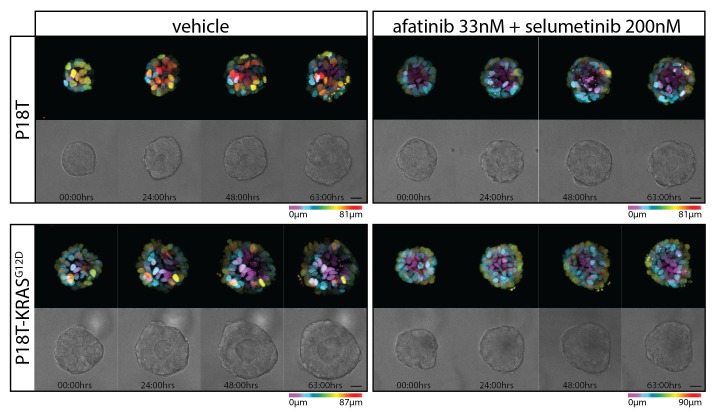
Figure 3—figure supplement 4. Stills from representative time-lapse imaging (three days) of CRC organoids P18T and P18T-KRASG12D treated with vehicle (DMSO) or a combination of targeted inhibitors afatinib (33 nM) and selumetinib (200 nM) (see also Video 2).

Figure 3—figure supplement 4.

In every panel, upper images show color-coded depth of maximum-projected z-stacks of H2B-mNeonGreen fluorescent organoids. Lower images: corresponding transmitted light images. Time interval: 15 min. Scale bars, 20 µm. Representative time-lapse of five organoids per condition.