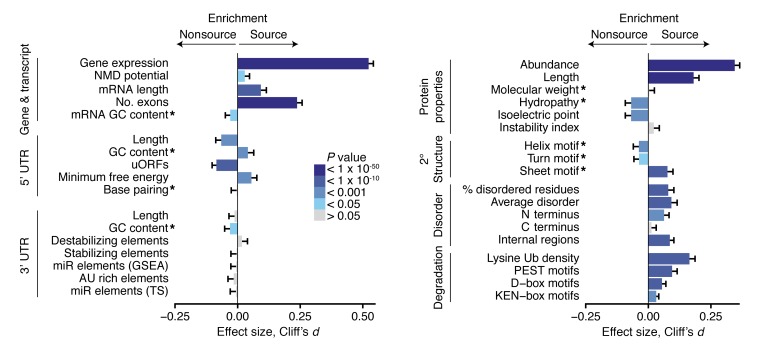
Figure 3. Features of MAP source and nonsource genes, transcripts, and proteins.
Error bars represent a 95% CI based on bootstrapping for Cliff’s d value, a nonparametric measurement of effect size. P values derived from 2-sided Wilcoxon tests; 6,195 source and 4,380 nonsource genes and gene products were studied for each comparison. * indicate features that were normalized for the respective transcript, UTR, or protein lengths. See Methods for details of how each feature was calculated. miR, microRNA; TS, TargetScan software; Ub, ubiquitination site.

