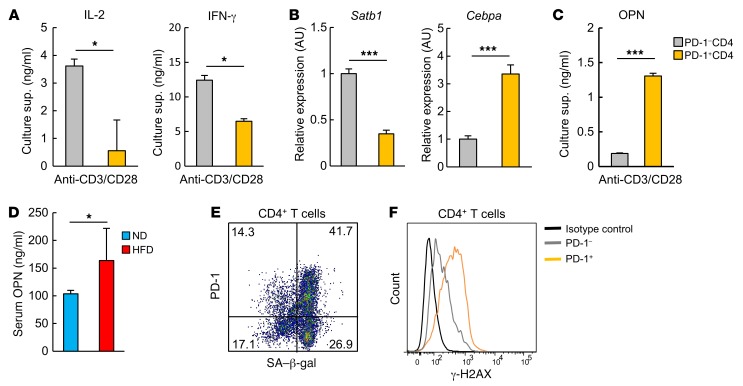
Figure 3. Adipose PD-1+CD4+ T cells secrete a large amount of OPN at the cost of normal function.
PD-1+ and PD-1–CD4+ T cells were separately isolated from VAT of 18-week-old HFD-fed mice. (A) VAT PD-1+ and PD-1–CD4+ T cells were cultured in the presence or absence of anti-CD3 and anti-CD28 mAb for 3 days. IL-2 and IFN-γ in the culture supernatants (sup.) were assessed on day 3 by ELISA (n = 3 mice per group). (B) VAT PD-1+ and PD-1–CD4+ T cells were analyzed for Satb1 and Cebpa mRNA expression by real-time PCR (n = 5 mice per group). (C) VAT PD-1+ and PD-1–CD4+ T cells were cultured in the presence or absence of anti-CD3 and anti-CD28 mAb for 3 days. OPN in the culture supernatants was assessed on day 3 by ELISA (n = 3 mice per group). (D) Serum OPN levels in mice fed an ND or HFD for 14 weeks (n = 5 mice per group). (E) Representative flow cytometric analysis demonstrating SA–β-gal activity. (F) Representative flow cytometric analysis demonstrating the phosphorylated histone H2AX at serine 139 (referred to as γ-H2AX) of VAT CD4+ T cells. Flow cytometric plots are representative of at least 3 independent experiments. Data represent the mean ± SEM. *P < 0.05 and ***P < 0.0001, by 2-tailed Student’s t test.

