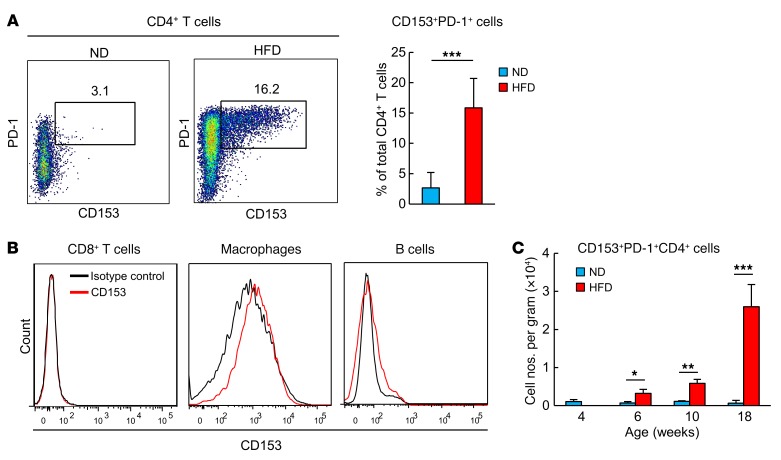
Figure 4. CD153+PD-1+CD4 T cells increase almost exclusively in the VAT of HFD-fed mice.
(A) Analysis of VAT CD153+PD-1+CD4+ T cells isolated from WT mice after 14 weeks on an ND or HFD (n = 7 mice per group). (B) Flow cytometric analysis of CD153 expression on CD8+ T cells, macrophages, and B cells. (C) Temporal dynamics of changes in CD153+PD-1+CD4+ T cells after an HFD (n = 5 mice per group). Flow cytometric plots are representative of at least 3 independent experiments. Data represent the mean ± SEM. *P < 0.05, **P < 0.001, and ***P < 0.0001, by 2-tailed Student’s t test.

