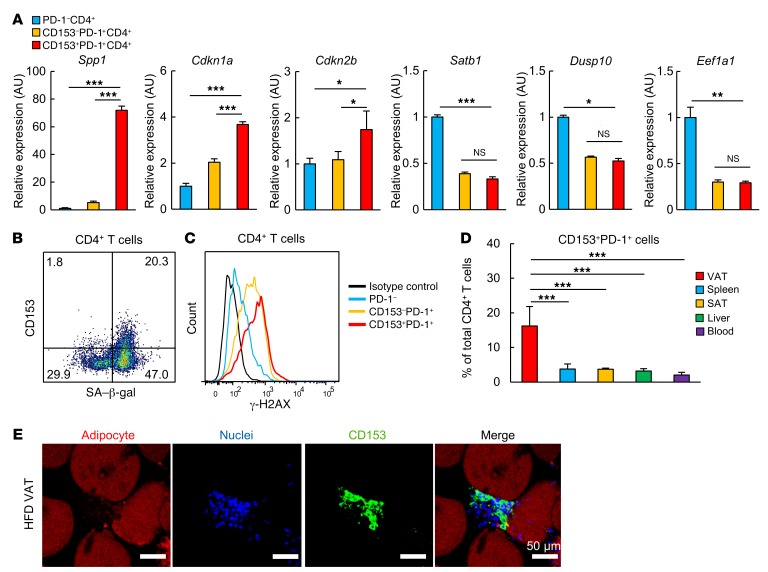
Figure 5. CD153+PD-1+ CD4 T cells have the features of cellular senescence.
(A) PD-1–, CD153–PD-1+, and CD153+PD-1+CD4+ T cells were separately isolated from VAT of WT mice fed an HFD. Analyses of Spp1, Cdkn1a (Cip1), and Cdkn2b (Ink4b), Satb1, Dusp10, and Eef1a1 expression by real-time PCR (n = 5 mice per group). (B) Analyses of SA–β-gal activity (n = 5 mice per group). (C) Analyses of γ-H2AX expression. Data were obtained from the same sample as that for Figure 3F. (D) Localization of CD153+PD-1+CD4+ T cells in various tissues. (E) Histological analyses of VAT from WT mice after 14 weeks on an HFD. Adipocytes (BODIPY, red), CD153 (yellow), and nuclei (DAPI, blue). Scale bars: 50 μm. Flow cytometric plots are representative of at least 3 independent experiments. Data represent the mean ± SEM. *P < 0.05, **P < 0.001, and ***P < 0.0001, by ANOVA followed by post hoc Bonferroni tests.

