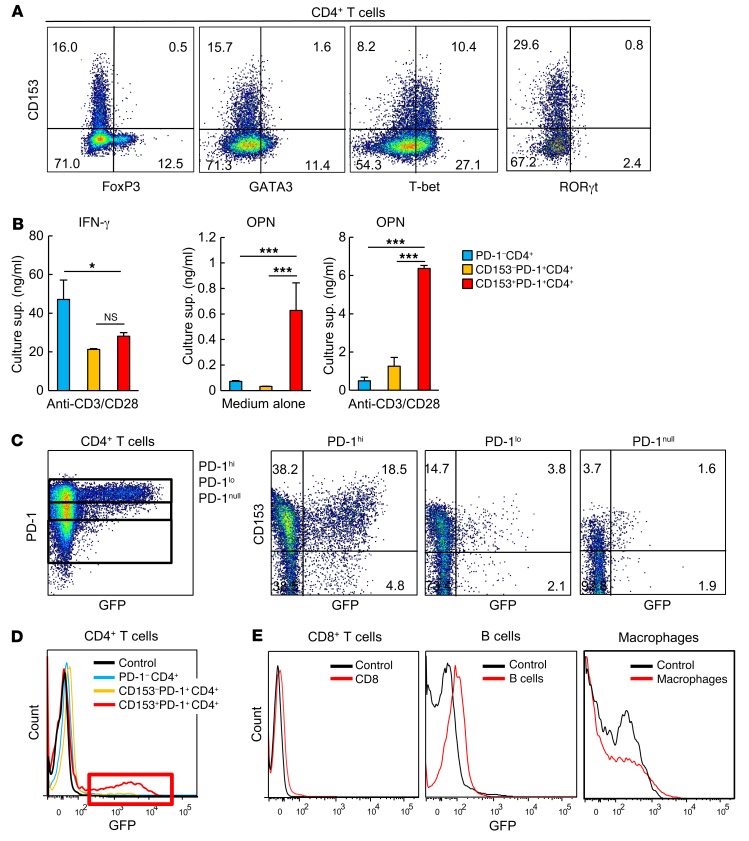
Figure 6. Adipose CD153+PD-1+CD4+ T cells are the main source of OPN in VAT of HFD-fed mice.
(A) Representative flow cytometric analysis demonstrating the expression of FoxP3, GATA3, T-bet, and RORγt in CD153+PD-1+CD4+ T cells. (B) PD-1–, CD153–PD-1+, and CD153+PD-1+CD4+ T cells were separately isolated from VAT of WT mice fed an HFD. The indicated CD4+ T cells were cultured in the presence of anti-CD3/CD28 mAb for 3 days. IFN-γ and OPN concentrations in the culture supernatants were assessed by ELISA (n = 5 mice per group). *P < 0.05 and ***P < 0.0001, by ANOVA followed by post hoc Bonferroni tests. (C) Representative flow cytometric analysis of EGFP-Spp1 in PD-1+CD4+ T cells obtained from VAT of EGFP-Spp1–KI reporter mice fed an HFD (far left). CD153+ and EGFP-Spp1 in PD-1hi, PD-1lo, and PD-1nullCD4+ T cells obtained from VAT of EGFP-Spp1–KI reporter mice fed an HFD (right 3 panels). (D) Representative flow cytometric analysis of EGFP-Spp1 in the indicated cells obtained from VAT of EGFP-Spp1–KI reporter mice fed an HFD. Red box shows high fluorescence intensity of GFP in CD153+PD-1+CD4+ T cells. (E) Representative flow cytometric analysis of EGFP-Spp1 in CD8+ T cells, B cells, and macrophages obtained from the VAT of EGFP-Spp1–KI reporter mice fed an HFD. Flow cytometric plots are representative of at least 3 independent experiments. Data represent the mean ± SEM.

