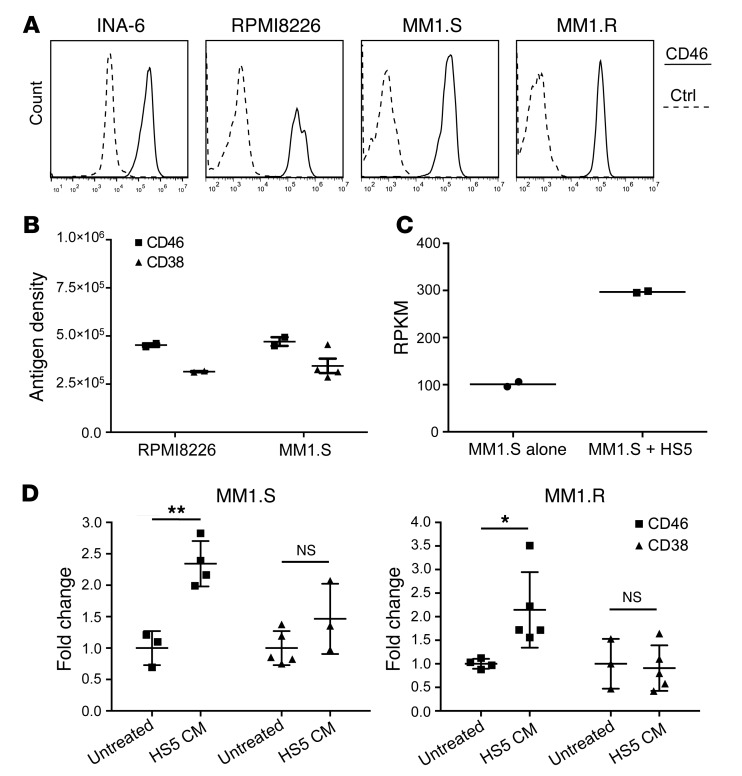
Figure 1. CD46 is highly expressed on MM cells and is further increased in the setting of BM microenvironment.
(A) CD46 expression in INA-6, RPMI8226, MM1.S, and MM1.R measured by FACS (solid lines), compared with nonbinding control (Ctrl = dashed lines, representative data, n = 3). (B) CD46 antigen density estimation compared with CD38 on RPMI8226 and MM1.S (data represent mean ± SEM, n = 3). (C) Coculture of MM1.S with HS5 BM stromal cells increases the expression of CD46 mRNA (n = 2). RPKM, reads per kilobase of transcript per million mapped reads. (D) CD46 and CD38 antigen densities in RPMI8226 and MM1.S, incubated with or without HS5-conditioned media (CM) for 3 days (data represent mean ± SEM, n = 3–5). Two-tailed Student’s t test, *P < 0.05, **P < 0.01.

