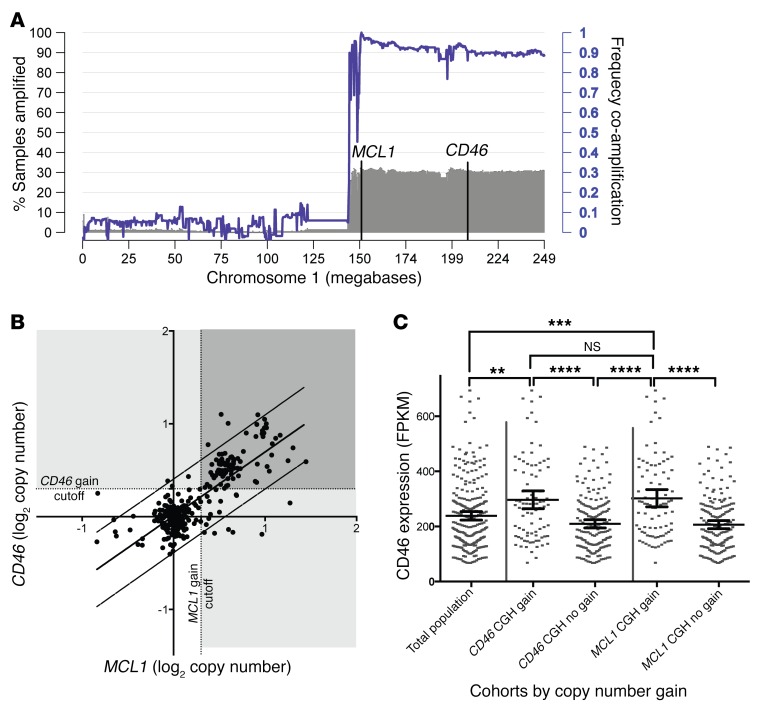
Figure 5. CD46 locus is frequently coamplified with 1q21, and copy gain for either MCL1 or CD46 identifies patients with high CD46 expression.
(A) About 30% of newly diagnosed patients demonstrate 1q21 copy gain overlapping the MCL1 locus by array comparative genomic hybridization (CGH), defined as log2 copy number >0.3, and a similar proportion demonstrate amplification along the 1q arm, including CD46 (gray shaded histogram; left axis). High frequency of coamplification along the 1q arm with MCL1 amplification is shown by the purple line and quantified on the right axis (n = 322 patients). (B) Dot plot of log2 CGH values in patient samples indicates that copy numbers for CD46 and MCL1 loci are highly correlated and cluster in regular copy number intervals (n = 322 patients). (C) Mean CD46 transcript expression values (quantified as fragments per kilobase per million mapped reads [FPKM]) for CD46 or MCL1 copy-amplified cohorts, defined by ≥0.3 log2 CGH value, versus nonamplified cohorts indicate high CD46 expression in MCL1 or CD46 amplified patient samples, compared with total population or samples without copy gain (n = 260 patients). Data represent mean ± 95% CI. One-way ANOVA with Tukey’s multiple comparison correction, **P < 0.01, ***P < 0.001, ****P < 0.0001.

