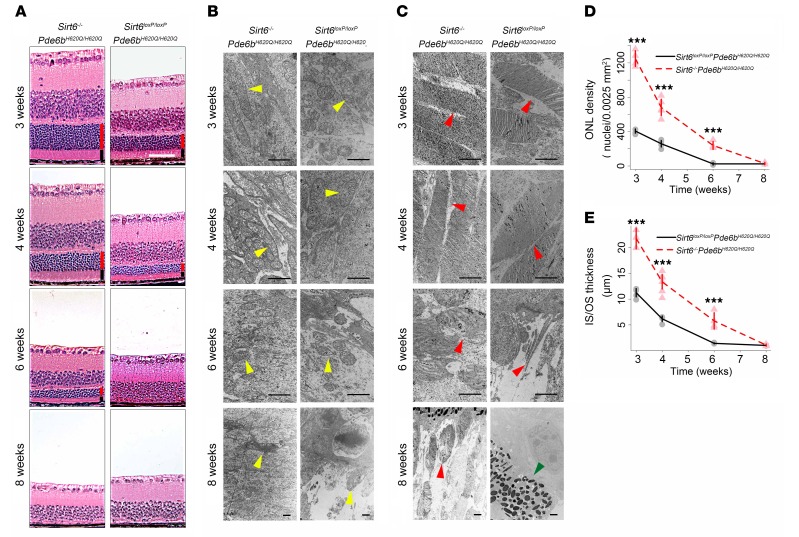
Figure 2. Sirt6 deficiency improves rod and cone survival and robustness.
(A) H&E staining of paraffin sections of retinae showed thicker ONL and IS/OS layers and greater concentration of photoreceptor nuclei in Sirt6–/–Pde6bH620Q/H620Q compared with Sirt6loxP/loxPPde6bH620Q/H620Q mice at 3, 4, and 6 weeks. Scale bar: 50 μm. Red bars represent ONL. Black bars represent IS/OS. (B) TEM reveals healthier mitochondria (yellow arrowheads) in treated mice, with more cristae and longer cell bodies in the Sirt6–/–Pde6bH620Q/H620Q mice than the Sirt6loxP/loxPPde6bH620Q/H620Q mice. However, by 8 weeks, both groups’ mitochondria appeared equally damaged. Scale bars: 1 μm. (C) TEM of OS (red arrowheads) of photoreceptors showed longer, more plentiful discs in Sirt6–/–Pde6bH620Q/H620Q compared with Sirt6loxP/loxPPde6bH620Q/H620Q mice. There was a decline over time in both groups, although by 8 weeks, the knockout group still retained detectable OS, while the control group appeared completely deficient in them. Green arrowhead points to the boundary between the RPE cells and the bipolar cells’ nuclei. Scale bars: 1 μm. (D and E) Quantification of the ONL density (nuclei/0.0025 mm2) (D) and IS/OS thickness (μm) (E) corroborated histological findings, confirming that Sirt6-deficient mice had significantly higher density and thickness of the ONL and IS/OS layers, respectively. Two-tailed t tests were used to analyze the data. ONL cell density at 3, 4, and 6 weeks P < 0.001; IS/OS thickness at 3 and 4 weeks, P < 0.001, at 6 weeks P = 0.002; 8 weeks, P = 0.6 for ONL density and IS/OS thickness. For Sirt6loxP/loxPPde6bH620Q/H620Q: n = 4 at 3 and 6 weeks, n = 5 at 4 weeks, n = 3 at 8 weeks; for Sirt6–/–Pde6bH620Q/H620Q: n = 5 at 3 and 4 weeks; n = 4 at 6 and 8 weeks. ***P < 0.001.

