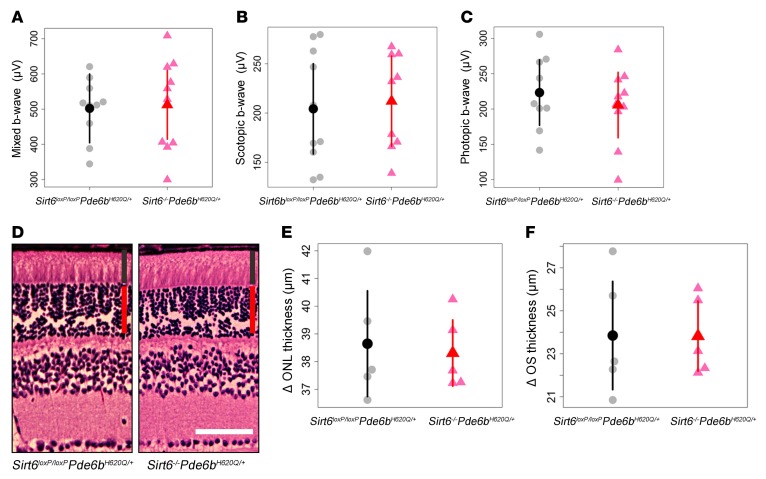
Figure 4. Sirt6 deficiency in WT background produces no phenotypic changes in functionality or morphology of photoreceptors.
(A–C) ERG mixed, scotopic, and photopic b-wave values showed no statistically significant difference between Sirt6–/–Pde6bH620Q/+ and Sirt6loxP/loxPPde6bH620Q/+ mice. Recordings were taken 3 months after tamoxifen injection. Gray dots represent values from individual Sirt6loxP/loxPPde6bH620Q/+ mice, while the black dot represents the mean. Similarly, light red triangles represent values from individual Sirt6–/–Pde6bH620Q/+ mice, and the red triangle, the mean. Error bars show SD; n = 5 for both groups. (D–F) H&E-stained retinal sections were collected from both groups at 4 months after tamoxifen injection. No differences in ONL or OS thickness were observed. Layer widths were quantified, and results confirmed histological findings. Graphical representations are as those described in A–C. n = 5 for both groups. Red vertical bars represent ONL; black bars represent IS/OS. Scale bar: 50 μm.

