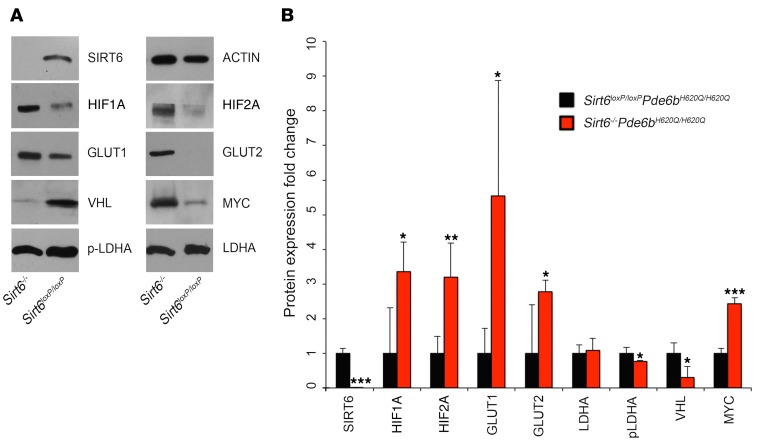
Figure 6. Sirt6 deficiency upregulates levels of glycolytic metabolism intermediates.
(A) Immunoblotting for regulators of glycolytic metabolism in the retinae of treated and untreated mice at P21 revealed increased levels of HIF1A and HIF2A; GLUT1 and GLUT2; and MYC in Sirt6–/–Pde6bH620Q/H620Q mice. There was a corresponding decrease in VHL protein and p-LDHA. No difference was detected for LDHA between the groups. β-Actin (ACTIN) was used as a loading control. (B) Protein expression was quantified to assess changes between Sirt6–/–Pde6bH620Q/H620Q and Sirt6loxP/loxPPde6bH620Q/H620Q mice, and a paired t test was used to determine statistical significance. HIF1A, HIF2A, GLUT1, GLUT2, and MYC were found to be increased in the Sirt6–/–Pde6bH620Q/H620Q mice compared with controls. SIRT6, VHL, and p-LDHA were found to be decreased in the Sirt6–/–Pde6bH620Q/H620Q group. No difference between groups was found for LDHA. SIRT6 P < 0.001, HIF1A P = 0.02, HIF2A P = 0.01, GLUT1 P = 0.04, GLUT2 P = 0.048, LDHA P = 0.68, p-LDHA P = 0.04, VHL P = 0.02, MYC P < 0.001. n = 4 for both groups. *P < 0.05, **P < 0.01, and ***P < 0.001.

