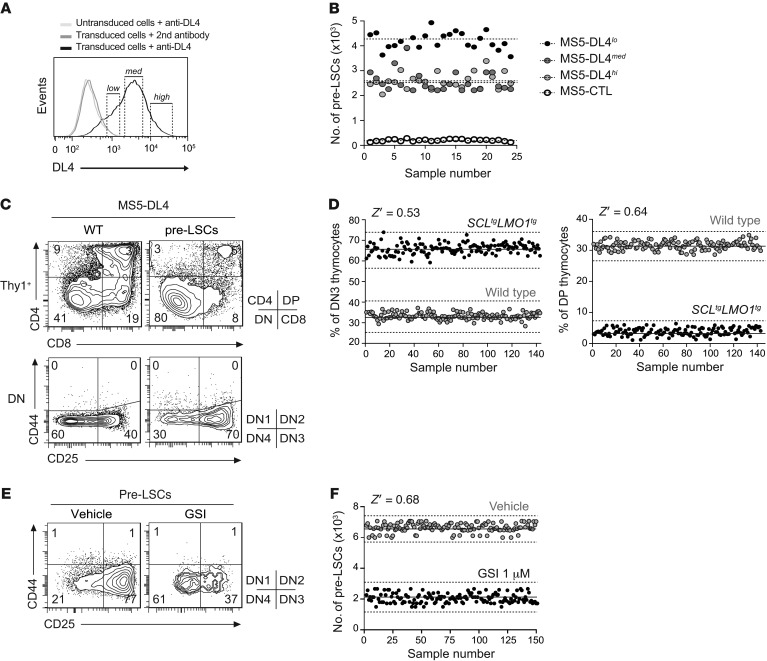
Figure 2. High-throughput assay for primary pre-LSCs in thymic-like microenvironment.
(A and B) Generation of an optimal MS5-DL4 stromal cell line for pre-LSC viability. Following DL4 gene transfer, MS5 stromal cells were assessed for DL4 surface expression levels. Three MS5 subclones were purified according to levels of DL4 expression (low, medium, and high) (A). DN3 preleukemic SCLtgLMO1tg thymocytes were cocultured with MS5-CTL or MS5-DL4lo, -DL4med, or -DL4hi stromal cells during 5 days, and the absolute number of DN3 cells was assessed using FACS. Each dot represents an individual well, and dashed lines represent the mean for each condition (B). (C) Purified DN3 WT and preleukemic SCLtgLMO1tg thymocytes were cocultured with MS5-DL4lo stromal cells. DN3-derived thymocytes were immunophenotyped 5 days later using the CD4, CD8, CD25, and CD44 markers. (D) Miniaturized coculture system for HTS-FACS in 384-well plate. The proportion of DN3 (left panel) and DP (right panel) thymocytes was then assessed using HTS-FACS, and assay reproducibility was calculated. Each dot represents an individual well. Solid lines and dashed lines represent the mean and 3-fold the SD, respectively. The Z′ factor is a statistical measure of the robustness of the HTS assay (ideally between 0.5 and 1). Representative of 3 independent experiments. (E and F) DN3 preleukemic SCLtgLMO1tg thymocytes were cocultured with MS5-DL4lo stromal cells for 5 days in the presence or absence (Vehicle) of γ-secretase inhibitor (GSI, 1 μM), and the absolute number of DN3 cells was assessed using HTS-FACS. Representative FACS analysis of DN population is shown (E) together with assay reproducibility (F).

