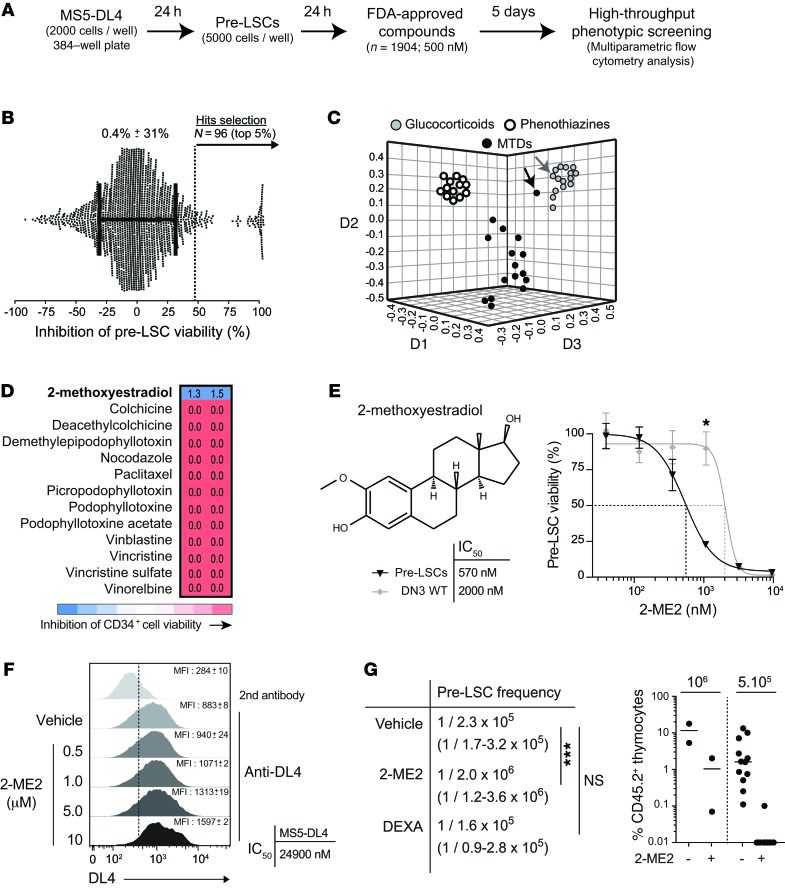
Figure 3. Small-molecule screening identifies 2-ME2 as an inhibitor of pre-LSCs.
(A) Experimental procedure for chemical screening of pre-LSCs. (B) The inhibition of pre-LSC viability was calculated for each compound (GSI set as 100% and DMSO as 0%; average pre-LSC viability: 0.4%). The top 5% (n = 96) of hits were selected. (C) Clustering of 44 selected compounds by structural similarities using the ChemMine tool (http://chemmine.ucr.edu/). The multidimensional scaling algorithm maps a compound described by its chemical structure into a 3D space and where neighbor compounds exhibit similar molecular structure. The axes (D1, D2, and D3) refer to the dimensions generated by the multidimensional scaling. Black arrow identifies 2-ME2 and gray arrow DEXA. MTDs, microtubule-targeting drugs. (D) 2-ME2 is the only MTD that does not affect the viability of human HSCs. Human CD34+ peripheral blood was collected from cord blood cells and treated with the indicated MTDs at 1 μM during 1 week as described previously (38). Numbers (n = 2) represent the fractions of viable cells compared with vehicle control. (E) 2-ME2 structure (top left panel) and dose-response on purified pre-LSCs and DN3 WT thymocytes. The percentages of cell viability are shown (right panel, n = 6, *P ≤ 0.05). IC50 was calculated (bottom left panel). Representative of 2 independent experiments. (F) MS5-DL4 stromal cells alone were treated in the same conditions. DL4 expression was assessed by FACS (left panel, n = 2), and IC50 for cell viability was calculated (right panel, n = 2). (G) Treated and untreated viable cells were then transplanted by limiting dilution assay into recipient mice according to Supplemental Figure 5A. Thymic engraftment was analyzed 6 weeks after transplantation, and pre-LSC frequencies were calculated (left panel) by Poisson statistics (CIs in parentheses; ***P ≤ 0.001). Right panel: Thymic reconstitution by control or 2-ME2–treated cells.

