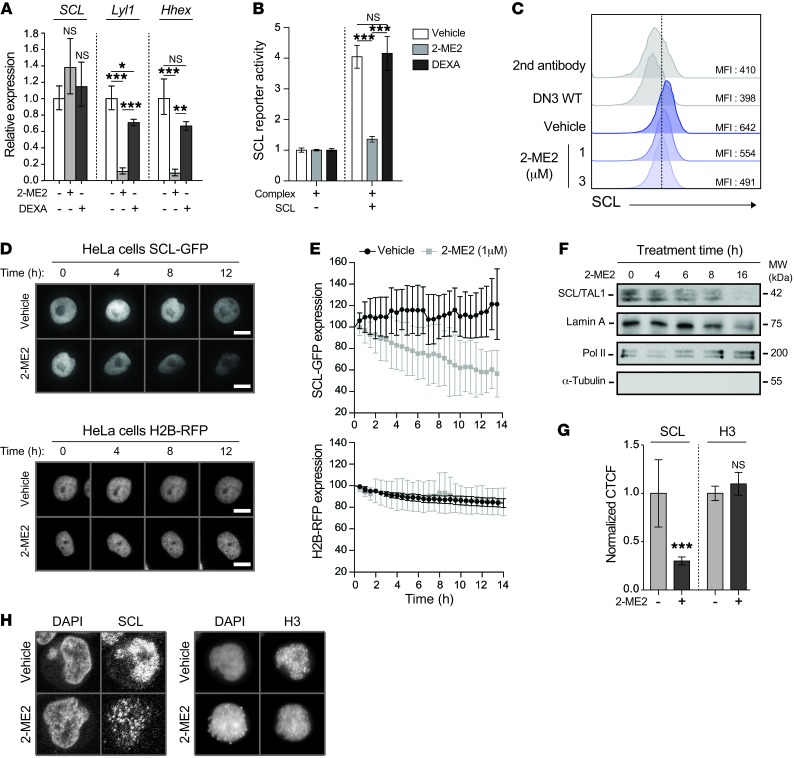
Figure 4. 2-ME2 inhibits the accumulation of SCL protein.
(A) Pre-LSCs from SCLtgLMO1tg thymocytes were treated with 2-ME2 (1 μΜ) or DEXA (5 nM) for 16 hours, and mRNA levels of SCL and SCL target genes Lyl1 and Hhex were determined by quantitative RT-PCR and normalized to β-actin (mean ± SD, n = 3, *P ≤ 0.05, **P ≤ 0.01, ***P ≤ 0.001). (B) 2-ME2 inhibits the activity of the SCL transcriptional complex. The Gypa promoter (Gypa-Luc) was used as a reporter. Transfected cells were then treated or not (Vehicle) with 2-ME2 (1 μM) or DEXA (2 nM) for 24 hours. Results are expressed as fold activation by SCL over the complex without SCL. Data represent the mean ± SD (n = 3, ***P ≤ 0.001). (C) Immunofluorescence of human SCL oncoprotein by flow cytometry in pre-LSCs from SCLtgLMO1tg thymocytes treated with the indicated doses of 2-ME2 or not (Vehicle) for 16 hours. DN3 WT thymocytes stained with antibody against SCL and cells stained with the secondary antibody only were used as negative controls. (D and E) Real-time imaging of HeLa cells expressing SCL-GFP or H2B-RFP in the presence or absence of 2-ME2 (1 μM). Kinetic of GFP (top panels) and RFP (bottom panels) expression in a representative treated or untreated cell is shown (D), and the averages of mean fluorescence intensities (MFIs) for each time point were calculated (E). MFIs were normalized to the initial intensity of the corresponding cell, which was set as 100%. (F) JURKAT cells were treated with 2-ME2 (1 μM) for the indicated times, and nuclear extracts were subjected to immunoblotting. Pol II, RNA polymerase II. (G and H) SCL and histone H3 intracellular immunofluorescence staining in JURKAT cells treated or not with 2-ME2 (1 μM) for 8 hours. The normalized corrected total cell fluorescence (CTCF) per nucleus of SCL (n = 27–98, ***P ≤ 0.001) and H3 (n = 42–60) was calculated (G). A representative example of SCL (left panel) and H3 (right panel) expression is shown (H). All data shown are representative of 2 independent experiments.

