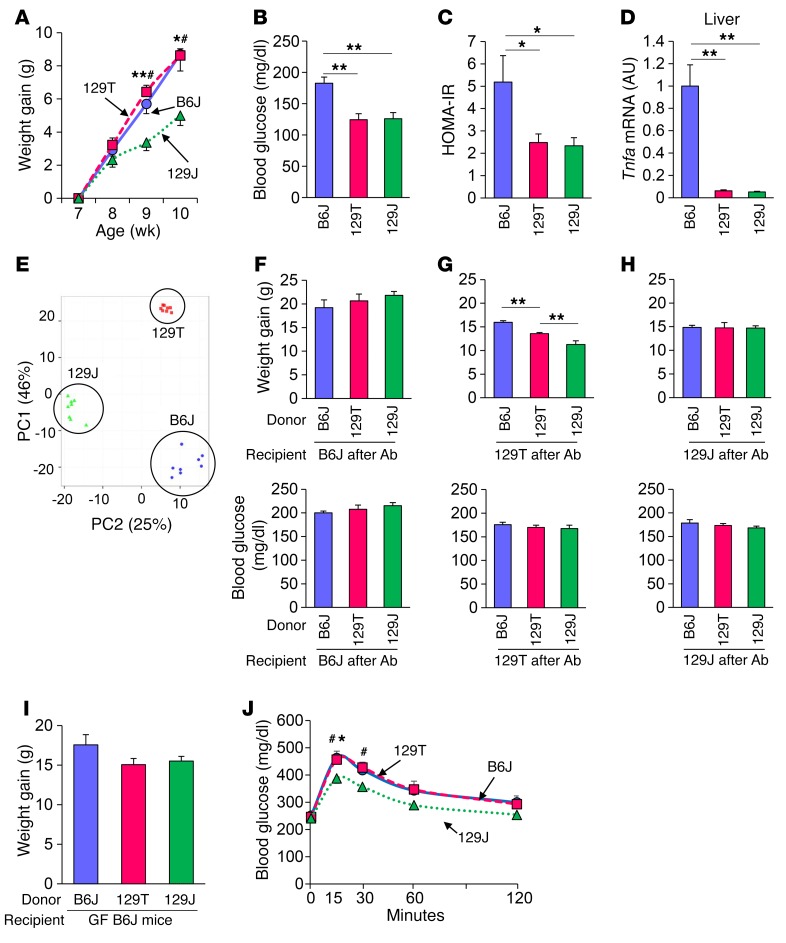
Figure 1. Microbiota affect adiposity and glucose metabolism depending on the host genetics.
(A) Weight gain of B6J (circles), 129T (squares), and 129J (triangles) mice on an HFD. #P < 0.05 (129T vs. 129J); *P <0.05 and **P < 0.01 (B6J vs. 129J), by ANOVA, followed by Tukey-Kramer post-hoc. (B) Blood glucose levels in the random fed state at 11 weeks of age (n = 4 per group). (C) Calculated HOMA-IR for B6J, 129T, and 129J mice after 8 weeks on an HFD (n = 8 per group). (D) Tnfa mRNA in liver from mice fed an HFD for 9 weeks as determined by qPCR (n = 8 per group). (E) PCA of fecal 16S rRNA sequencing data for HFD-fed mice of the 3 strains at 16 weeks of age (n = 8 per group). PC1, principle coordinate 1; PC2, principle coordinate 2. (F–H) Graphs show weight gain of HFD-fed B6J (F), 129T (G), and 129J (H) mice 10 weeks after undergoing transfer of cecal bacteria from B6J, 129T, and 129J mice (n = 6 per group). Graphs show blood glucose levels (fed) of recipient B6J (F), 129T (G), and 129J (H) mice measured 1 week after bacterial transfer. *P < 0.05 and **P < 0.01, by ANOVA, followed by Tukey-Kramer post-hoc. (I) Weight gain and (J) OGTT for HFD-fed, GF B6J mice colonized with cecal bacteria from B6J (circle), 129T (square), and 129J (triangle) mice measured 2 weeks after transfer (n = 7–10). #P < 0.05 (129T vs. 129J); *P < 0.05 (B6J vs. 129J), by ANOVA, followed by Tukey-Kramer post-hoc.

