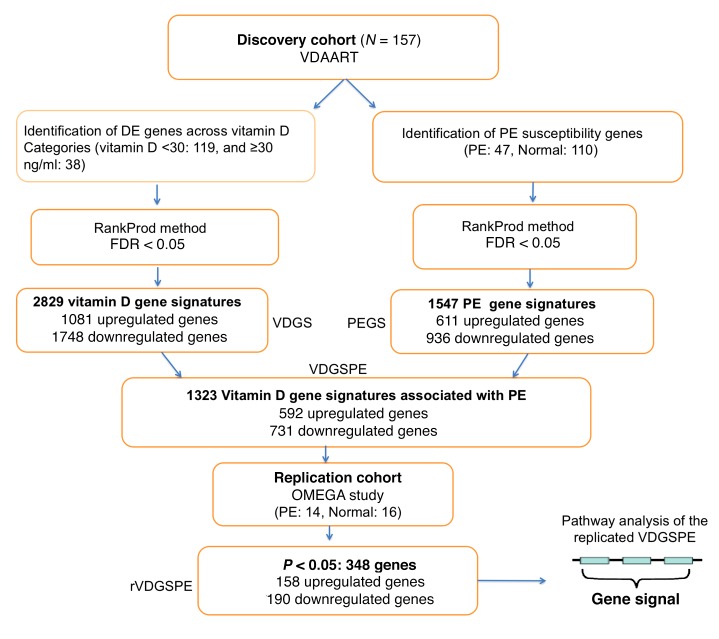
Figure 3. Gene expression study flow chart.
Summary of analysis approach and findings on gene expression analysis, through discovery and replication stages. Gene expression study was conducted using RankPord to identify differentially expressed genes in both discovery and replication cohorts (N = 157 and 30, respectively). PE, preeclampsia; DE, differentially expressed; VDGS, vitamin D gene signatures; PEGS, preeclampsia gene signatures; VDGSPE, vitamin D gene signatures associated with preeclampsia; rVDGSPE, replicated vitamin D gene signatures associated with preeclampsia; PPI, protein-protein interaction.

