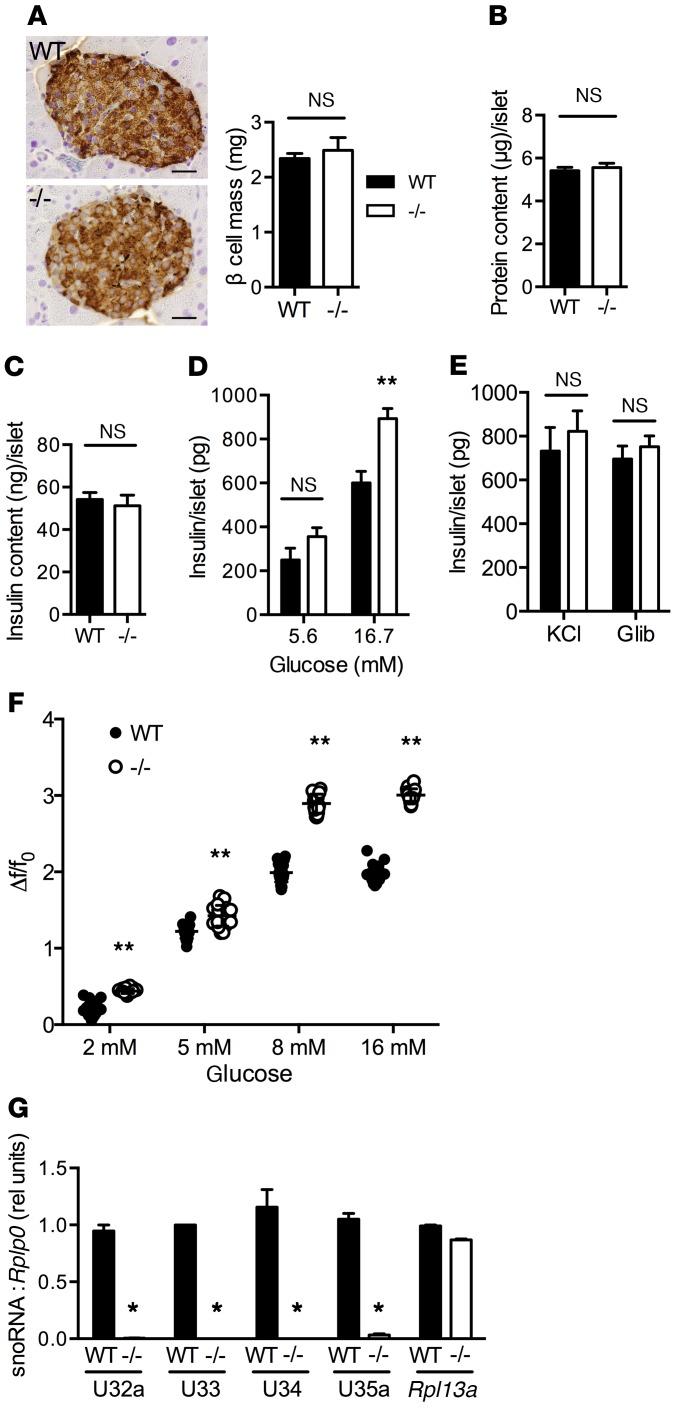
Figure 4. Rpl13a-snoless islets demonstrate enhanced glucose-stimulated insulin secretion.
(A) Representative insulin-stained pancreas sections with morphometric quantification of β cell mass for WT and Rpl13a-snoless (–/–) mice (n = 4 mice/genotype). Mean + SEM; n = 4 mice/genotype; scale bars: 25 μm. (B) Mean islet protein content (+SEM) quantified in 8 mice/genotype (10 islets/mouse) obtained from 3 independent experiments. (C) Mean islet insulin content (+SEM) quantified in 12 mice/genotype (10 islets/mouse) obtained from 3 independent experiments. (D) Mean islet insulin secretion (+SEM) in response to low and high glucose quantified in a minimum of 9 mice/genotype over 3 independent experiments. (E) Mean islet insulin secretion (+SEM) in response to 30 mM KCl and 1 μM glibenclamide quantified in 3–4 mice/genotype over 3 independent experiments. (F) Changes in Fluo-4–quantified calcium activity of islets relative to basal, expressed as Δf/f0 for differing glucose concentrations. Data from 20 independent cells from 4 mice/genotype. (G) RT-qPCR-quantified expression of Rpl13a snoRNAs and mRNA in islets (relative to Rplp0). n = 3 independent islet preparations/genotype. **P < 0.001; *P < 0.05; for –/– vs. WT determined by unpaired t test.

