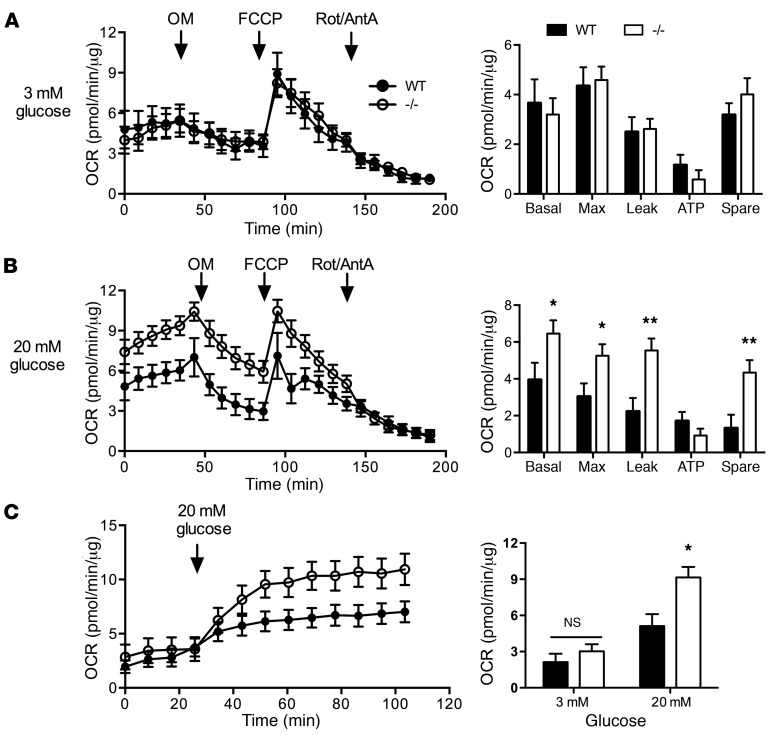
Figure 5. Increased mitochondrial leak in Rpl13a-snoless islets.
(A) OCR of WT and –/– islets at 3 mM glucose with injection of oligomycin (OM), FCCP, and rotenone and antimycin A (Rot/AntA). Data points in line graphs (left) represent mean values (±SEM) from 3 independent experiments in which islets pooled by genotype were used to generate a total of 9 (WT) or 8 (–/–) technical replicates from n = 11 WT and n = 12 –/– mice. Bar graphs (right) report calculated mean (+SEM) oxygen consumption for basal and maximal (Max) respiration, proton leak, ATP production and spare respiratory capacity. (B) OCR of WT and –/– islets at 20 mM glucose, as in A. Data points from 3 independent experiments in which islets pooled by genotype were used to generate a total of 9 (WT) or 11 (–/–) technical replicates from n = 13 WT and n = 14 –/– animals. Graphs as in A. (C) OCR of WT and –/– islets initially maintained at 3 mM glucose; this was changed at the time indicated to 20 mM glucose. Data points represent mean values (±SEM) from 3 independent experiments in which islets pooled by genotype generated 12 (WT) or 8 (–/–) technical replicates from n = 15 WT and n = 10 –/– animals. *P < 0.05 for –/– vs. WT; **P < 0.01 for –/– vs. WT determined by unpaired t test.

