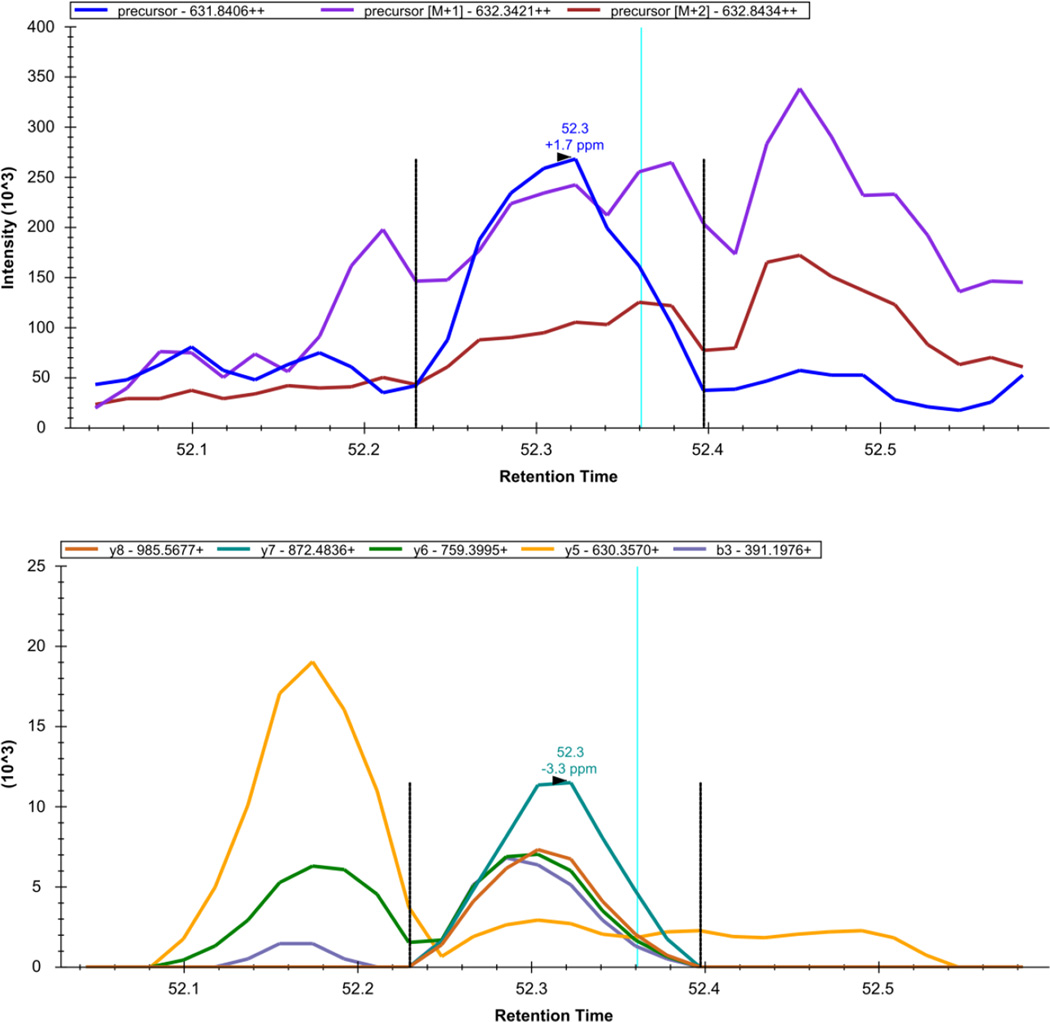
Figure 13. Skyline - DIA Data: NYIIEELNVR++.
The extracted precursor (top) and fragment ion (bottom) signal extracted for the peptide precursor NYIIEELNVR++ from DIA data acquired on a yeast sample digest using this protocol are plotted. The vertical lines on either side of the peak indicate the integration boundaries for the peak. The vertical blue line shows the retention time of the peptide identification contained in the spectral library generated from DDA data. The mass measurement error and retention time of the most intense transition (fragment ion data) or isotopic peak of (precursor data) for the peptide precursor are annotated above the chromatographic peak.

