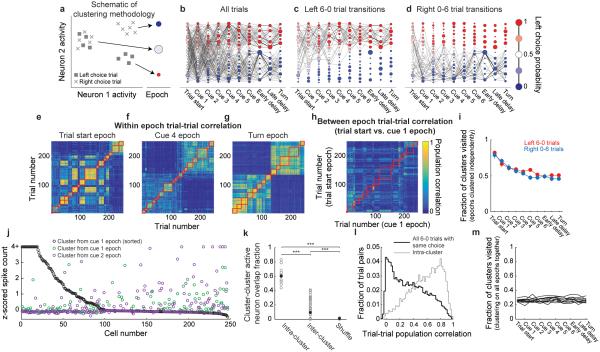
Figure 3. Clustering neuronal activity across trials reveals trial-to-trial variability.
a, Schematic demonstrating clustering procedure (Methods M.4.6). At each of ten spatially-defined maze epochs, clustering grouped individual trials with similar population activity patterns. Clusters at each maze epoch were represented as a column of nodes with area proportional to the number of trials in each cluster. Nodes were colored based on the fraction of trials within each cluster resulting in a left choice. Nodes were sorted vertically from largest to smallest left choice probability. b, Example transition matrix constructed from all trials in a single dataset. Edge widths between nodes represent the forward transition probability. c-d, Transition probabilities for left 6-0 (c) and right 0-6 (d) trials using the clusters derived from all trials as in b. e-g, Example trial-trial population activity correlation matrices at the trial start epoch (e), cue 4 epoch (f), and the turn epoch (g) sorted by cluster identity. Red squares indicate pairs of trials that were in the same cluster. h, Example trial-trial population activity correlation matrix for two consecutive epochs (trial start epoch compared to cue 1 epoch). Trials were sorted according to the cluster identity during the trial start epoch. Because trials were sorted identically in both epochs, trial pairs along the diagonal would be expected to have high correlations if trial activity was similar in consecutive epochs. In contrast, the low correlations along the diagonal suggest that trials had highly different population activity in consecutive epochs. i, Fraction of clusters visited at each epoch decreased to only 0.5, suggesting that much trial-trial variability remained even at the turn. j, z-scored activity of cells in two clusters during correct left 6-0 trials at the cue 1 epoch (black and green) and one cluster at the cue 2 epoch (purple). Cells were sorted according to their activity in the black cluster. k, Overlap fraction of active neurons (z-score > 1.5) within the same cluster (intra-cluster) and across clusters (inter-cluster), defined as: (number of neurons active in both clusters / number of neurons active in either cluster). Small inter-cluster overlap suggested that a largely distinct group of neurons was active in each cluster. Overlap fractions were calculated separately for correct left 6-0 and right 0-6 trials. Shuffled overlap index was calculated by shuffling the assignment of trials to clusters. ***P < 0.001, two-sample Student’s t-test. Gray points are individual cluster pairs and black points are means within each group. l, Distribution of pairwise trial-trial population activity pattern correlations for pairs of trials with identical cues and choices at the turn epoch for all 6-0 trials (black) and only trial pairs in the same cluster (gray). m, Fraction of clusters visited at a given epoch when clustering was performed on all epochs together (Methods M.4.6.4). All trial types were included. Individual lines represent datasets (n = 11).

