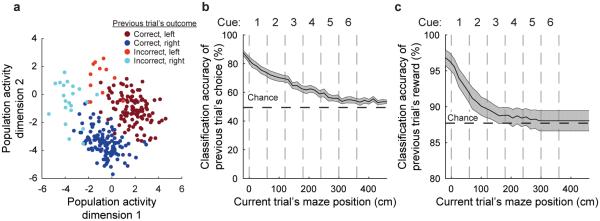
Figure 5. Neuronal population activity in the current trial reflects the previous trial’s choice and outcome.
a, Population activity patterns on different trials at the trial start epoch colored by the choice and outcome (reward or no reward) of the previous trial. Dimensionality was reduced using factor analysis for visualization purposes. Each circle is one trial. b-c, Both the previous trial’s choice (b) and if the previous trial was rewarded (c) could be classified based on the population activity. Independent SVM classifiers were trained and tested at each maze position. Error bars represent mean ± s.e.m. across datasets (n = 11).

