
Figure 6. Rate and distribution of SLAV events in healthy brain cells.
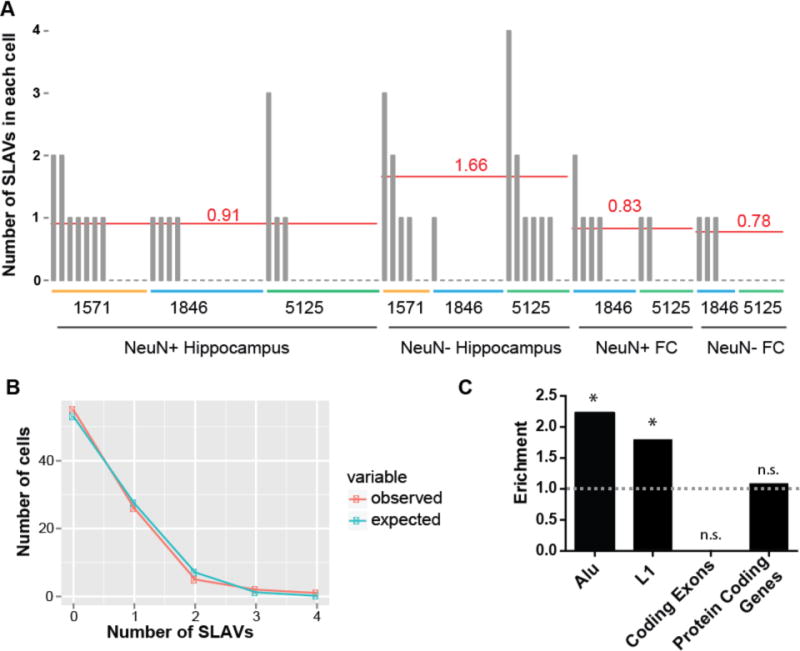
(A) The number of somatic L1 candidates in each cell that was sequenced (one bar represents one cell). The average number of insertions per cell type, normalized for detection rate of known non-reference insertions, is represented by the red line. FC, frontal cortex. (B) The distribution of SLAVs per cell follows closely a Poisson distribution (χ2 test p-value=0.26). (C) SLAVs are enriched in germline Alu and L1 regions and are not depleted from protein coding genes (exons plus introns). No SLAVs were detected in coding exons. (* indicates p<0.05, exact binomial test)