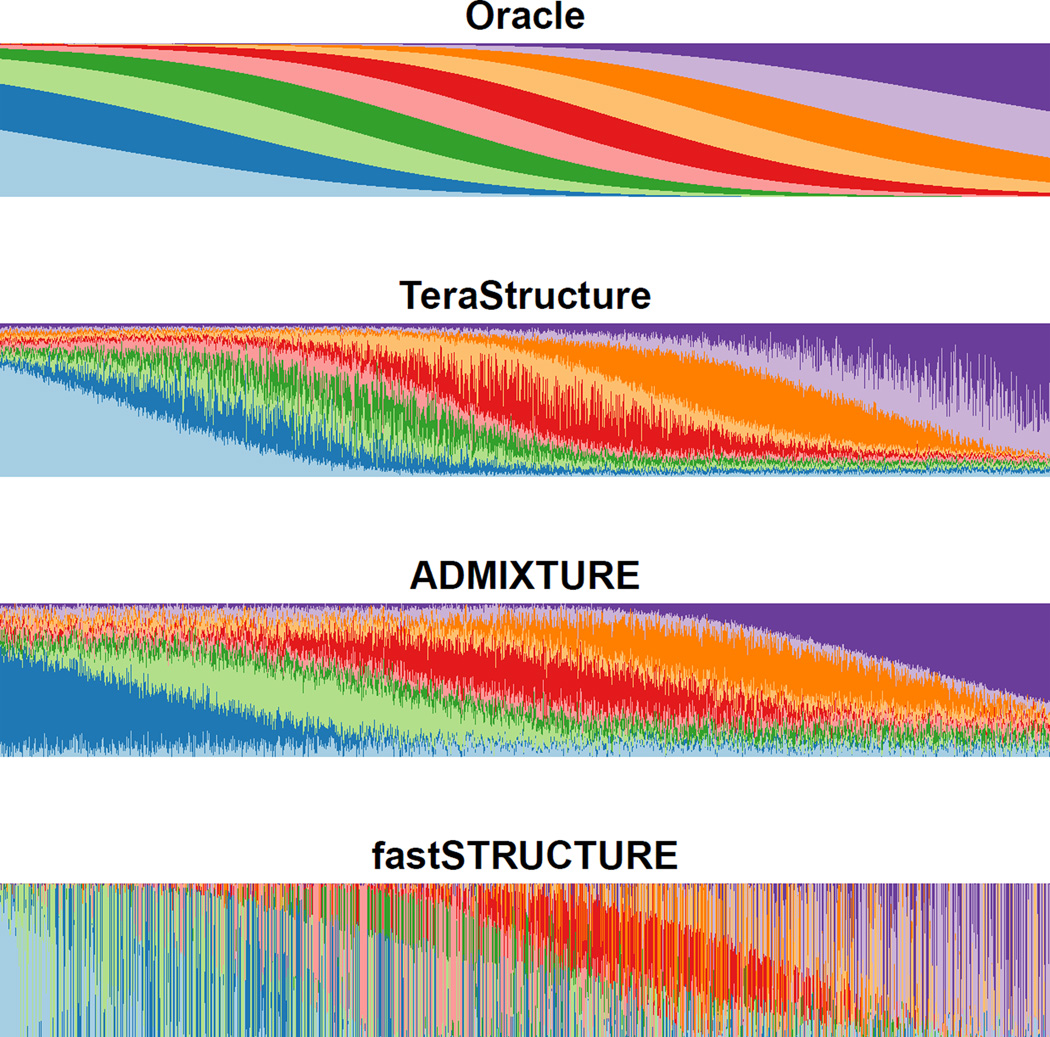
Figure 3.
TeraStructure is the most accurate method for Scenario B simulations. The top panel shows the used to simulate the data, where each individual’s proportions are a function of their position, e.g. the left most individual’s proportions are dominated by the two blue ancestral populations while the right most individual’s proportions are dominated by the two purple ancestral populations. A quantitative measure of the accuracies can be found in Supplementary Table 2.

