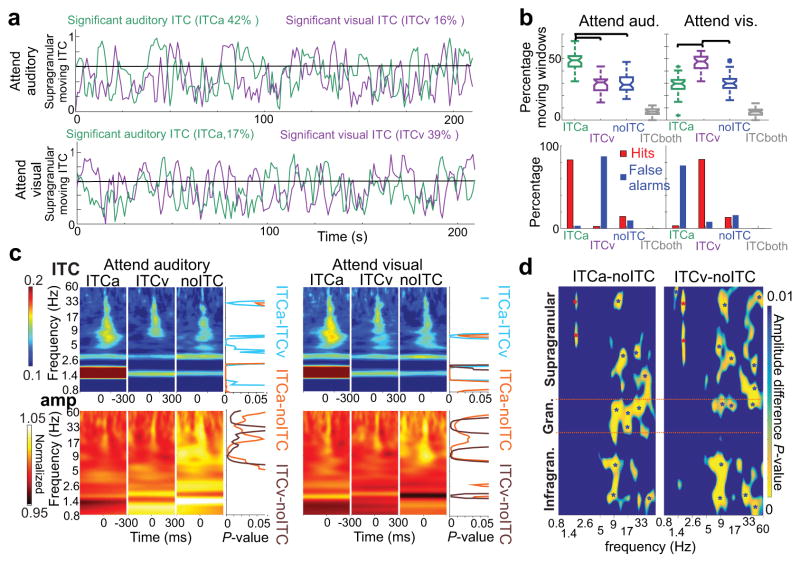
Figure 3. Long timescale dynamics of oscillatory entrainment during a continuous selective intermodal attention task.
(a) Moving delta ITC values from a representative supragranular electrode site. Green traces were calculated using the timing of non-BF tones, while purple traces were calculated using the timing of LED flashes in attend auditory (top) and attend visual (bottom) trial blocks. The black horizontal line denotes the level above which auditory moving ITC is significant. (b) On top, green and purple boxplots show the percentage of time windows with significant auditory (ITCa), and visual (ITCv) delta ITC respectively, during attend auditory (left) vs. attend visual (right) trial blocks across all experiments (n=36). Blue and gray boxplots show the percentage of time windows with no significant delta ITC related to any of the streams (noITC), and significant ITC related to both streams (ITCboth). Boxplots have lines at lower quartile, median, and upper quartile values, while whiskers show the extent of the data. Significant ITC indicating entrainment occurred significantly more related to cued modality streams (n=36, Tukey’s test, attend auditory: pITCa-ITCv=2.33×10⁻⁶, pITCa-noITC=3.67×10⁻⁶, pITCa-ITCboth=3.77×10⁻⁹, pITCv-noITC=0.99, pITCv-ITCboth=1.3×10⁻⁷, pnoITC-ITCboth=7.9×10⁻⁸; attend visual: pITCa-ITCv=1.51×10⁻⁶, pITCa-noITC=0.97, pITCa-ITCboth=5.18×10⁻⁷, pITCv-noITC=1.32×10⁻⁵, pITCv-ITCboth=3.77×10⁻⁹, pnoITC-ITCboth=4.89×10⁻⁸). On the bottom, bars denote the percentage of hits and false alarms during the same 4 time periods demarcated by differing ITC (ITCa, ITCv, noITC and ITCboth). Hits during periods of no entrainment (noITC) occurred significantly less than during entrainment by the cued modality stimuli (n=36, Wilcoxon signed rank, pattend_auditory=1.8×10⁻⁷, pattend_visual=1.4×10⁻⁷), and false alarms occurred significantly less than during entrainment by the to be ignored modality stimuli (pattend_auditory=7.8×10⁻⁴, pattend_visual=3.5×10⁻⁶). (c) Auditory non-BF stimulus related ITC (upper) and amplitude (lower) time-frequency plots averaged across attend auditory (left) and attend visual (right) trial blocks during ITCa, ITCv, and noITC time-periods. To the right of the plots, traces show frequency specific p values (Wilcoxon signed rank, corrected) derived from statistically comparing ITC and amplitude values amongst ITCa-ITCv (light blue), ITCa-noITC (gold) and ITCv-noITC (brown) time-periods. (d) Laminar profiles of frequency (x axis) specific, Bonferroni corrected p values derived from statistically comparing amplitudes between ITCa-noITC and ITCv-noITC time-periods across all experiments (n=36) and cueing conditions (n=36*2=72, Wilcoxon signed rank). The blue color represents p values above 0.01. Red stars on the color-maps denote p values below 0.001 indicating significantly larger amplitudes in ITCa or ITCv vs. noITC conditions, while blue stars indicate significantly larger amplitudes during noITC time periods.

