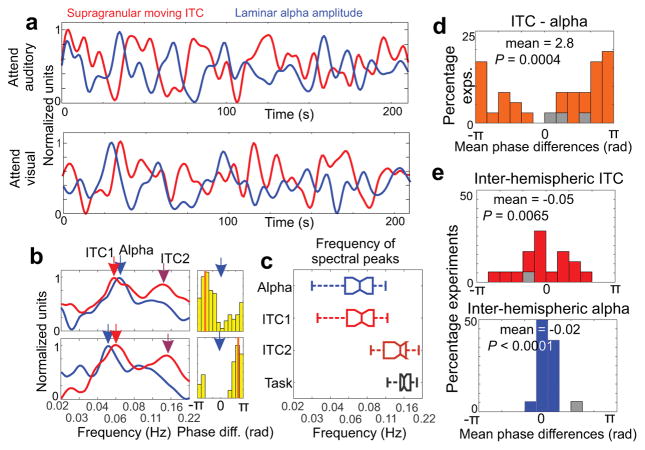
Figure 4. Slow counterphase fluctuation of delta oscillatory entrainment and alpha amplitude.
(a) Low pass filtered supragranular moving ITC and cross-laminar alpha amplitude waveforms from a representative attend auditory (top) and attend visual (bottom) trial block (same blocks as in Fig. 3a). (b) Representative spectra of supragranular moving ITC and cross-laminar alpha amplitude from 2 experiments. Light and dark red arrows denote prominent peaks in the spectrum of moving ITC, while blue arrows denote prominent peaks in the spectrum of moving alpha amplitude signals. Histograms to the right display the distribution of ITC-alpha phase difference at the frequency of the alpha spectrogram peak throughout the trial blocks. (c) Boxplots show the frequency of moving alpha (blue) and moving ITC spectral peaks (light red for the lower and dark red for the higher frequency peak), and the task frequency (grey) from all trial blocks. The boxplots have lines at lower quartile, median, and upper quartile values, while whiskers show the extent of the data. (d) Histogram shows that ITC-alpha mean phase differences pooled across experiments are significantly biased (n=36, Rayleigh test, p value and mean phase are displayed in the figure). Grey color denotes mean phases of non-significantly biased phase distributions. (e) The distributions of ITC-ITC (top) and alpha-alpha (bottom) mean phase differences derived from concurrently recorded left and right hemisphere A1 neuronal ensemble activity indicate synchronous modulation across hemispheres (n=18, Rayleigh test, p values and mean phases are displayed in the figure).

