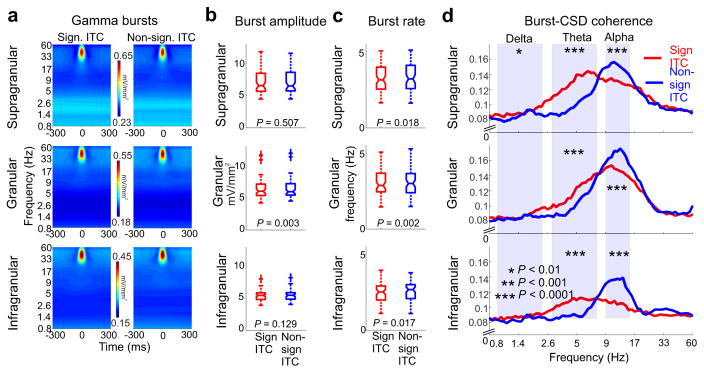
Figure 5. Entrainment correlated patterns of cross-frequency coupling.
(a) Time frequency amplitude maps show gamma bursts averaged across all experiments during time periods of entrainment (significant ITC, left) and no entrainment(non-significant ITC, right) from the different cortical layers. (b) Gamma burst amplitudes pooled across all experiments and cueing conditions during significant ITC (red) and non-significant ITC (blue) time-periods only show a significant difference in the granular layer (n=72, Wilcoxon signed rank, p values are displayed in the figure). The boxplots have lines at lower quartile, median, and upper quartile values, while whiskers show the extent of the data. (c) The rate of gamma bursts in different layers during significant ITC (red) and non-significant ITC (blue) time-periods shows a significant difference across all layers (n=72, Wilcoxon signed rank, p values are displayed in the figure)). As in panel B, the boxplots have lines at lower quartile, median, and upper quartile values, while whiskers show the extent of the data. (d) Layer specific burst-CSD coherence spectra. Stars denote significant differences in the delta, theta, and alpha frequency ranges in significant ITC vs. non-significant ITC periods (n=72, Wilcoxon signed rank, supragranular: pdelta=0.0014, ptheta=8.1×10⁻¹², palpha=5.5×10⁻⁵; granular: pdelta=0.03, ptheta=1.5×10⁻⁵, palpha=2.6×10⁻⁵; infragranular: pdelta=0.09, ptheta=2.9×10⁻⁵, palpha=2×10⁻⁶).

