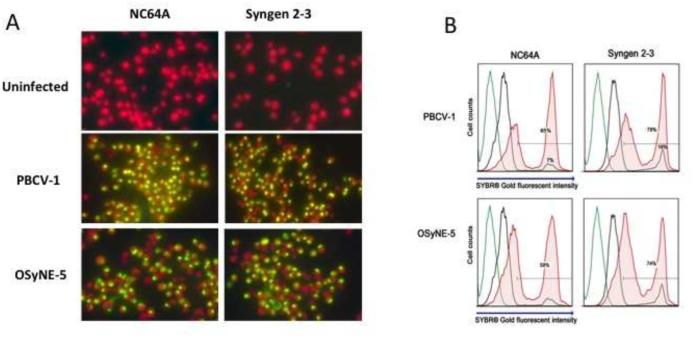
Figure 10.
A. SYBR® Gold uptake analysis of infected and uninfected C. variabilis cells with chlorovirus types 1 h PI A) Epifluorescent microscopy observations. Chlorophyll fluoresces red while DNA fluoresces yellow under UV light. SYBR® Gold is able to enter the cell and fluoresce the DNA when the virus attaches and initiates infection. Chlorophyll stains red and DNA yellow under UV light. B) Infected and uninfected NC64A and Syngen cells mixed with OSy-NE5 and PBCV-1 (1 h PI). The histogram depicts the level of SYBR® Gold stain intensity of infected and uninfected cells. SYBR® Gold intensity increases when chlorella cells were infected by their respective chloroviruses. The gating was set on an uninfected control sample stained with SYBR® Gold (black line) and applied to the infected samples. Negative control cells are plotted in green (no dye) and black (plus dye). Experimental cells mixed with the DNA dye (SYBR® Gold) 1 h PI are plotted in red. Samples were run at 1 × 10⁶ cells/ml, and approximately 1 × 10⁴ cell events were collected per sample.

