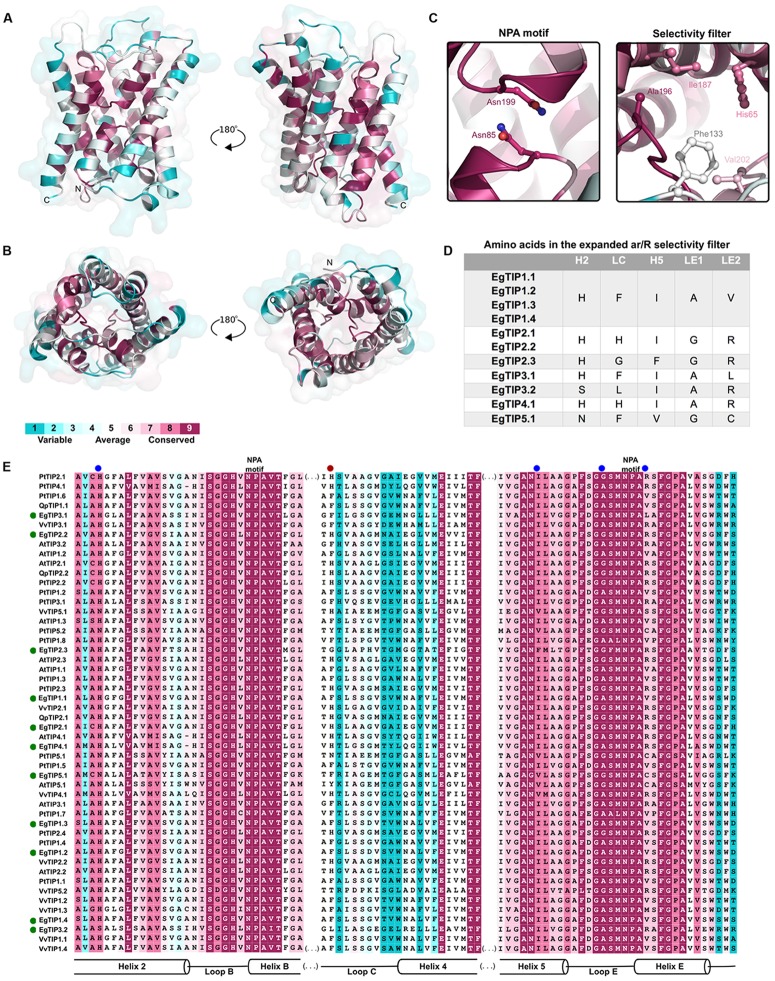
FIGURE 3.
Conservation of the EgTIP proteins. The protein sequences employed for the construction of the phylogenetic tree were used and residues were colored according to conservation. (A) Lateral view of EgTIP1.1 shown in ribbon representation in two positions. (B) Top and bottom views of EgTIP1.1. (C) Residues of the NPA motif and selectivity filter shown in stick representation. (D) Residues of the expanded selectivity filter. (E) Multiple sequence alignment colored according to the surfacing mapping of the EgTIP1.1 model. The green and blue dots indicate EgTIP sequences and residues of the selectivity filter, respectively. The red dot corresponds to the residue from the expanded selectivity filter.

