
Figure 8.
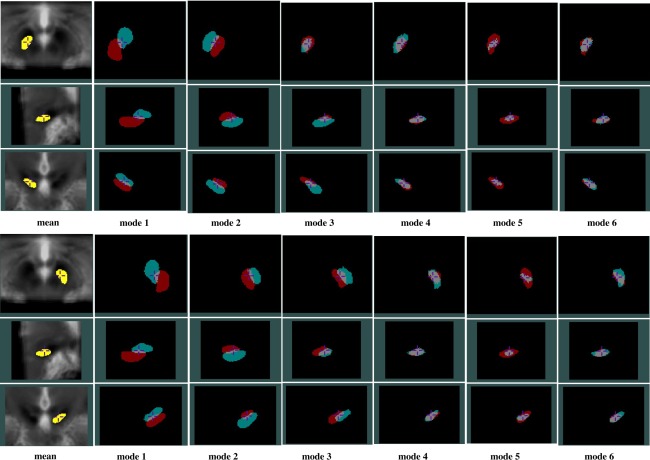
PCA analysis results for the left (top three rows) and right (bottom three rows) SN showing effects of the first six variation modes and the mean shape overlaid on an average of AC‐PC normalized T2w MRIs. For each variation mode shown, the cyan color label represents mean shape minus threefold standard deviation while the red color label represents mean shape plus threefold standard deviation. Note that in each group of figures demonstrating the left or right SN, the cross‐hair cursor is placed at the same position, and the three rows show the axial, sagittal, and coronal views (from top to bottom) of the nucleus.