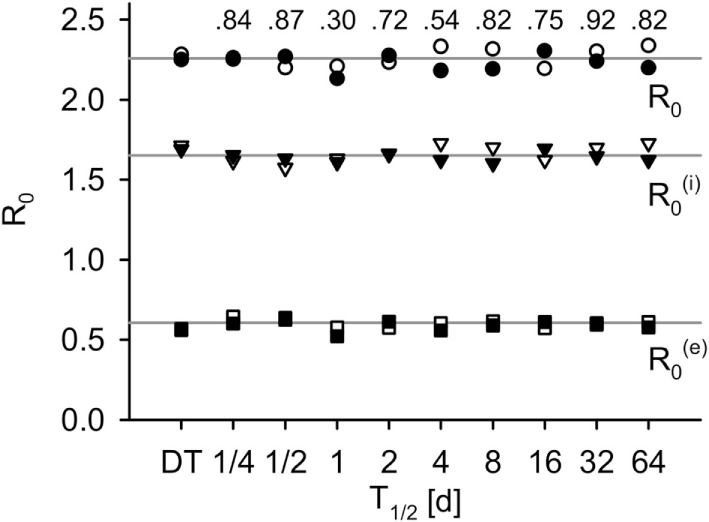
Figure 3.

R0 measured in simulations for the DT model and for the IT model with different pathogen half-life, in total, within-group and between-group component (average of 500 simulations). Black: without population dynamics, white: with population dynamics. Lines indicate the theoretical values, and . Numbers indicate p-values of two-sided Mann–Whitney U tests of total R0 without population dynamics against DT model (H0: not different from DT).
