
Figure 4.
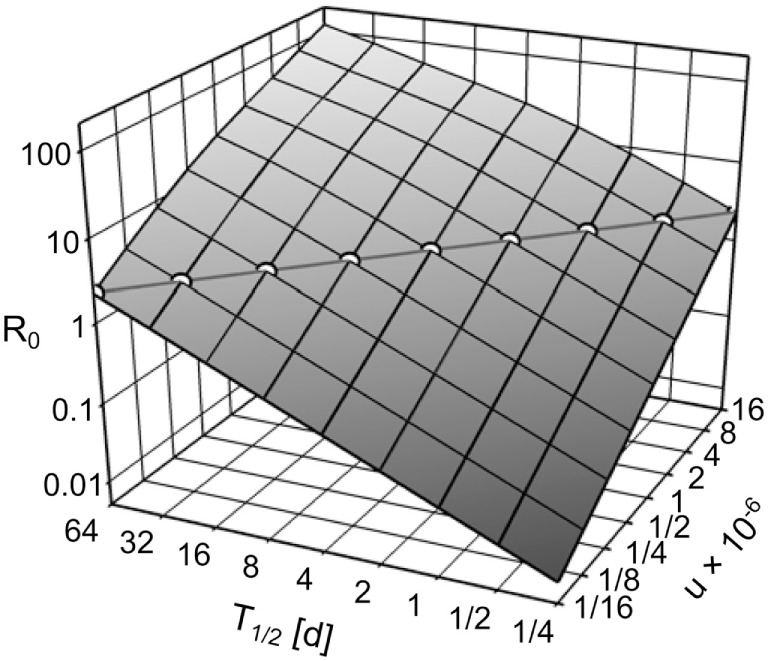
R0, depending on the environmental pathogen half-life T1/2 and on the uptake rate u. Circles along the diagonal line show the realizations of T1/2 and u used in the simulation experiments (u × T1/2 = 4 × 10⁻⁶), resulting in R0 = 2.259.
Official websites use .gov
A
.gov website belongs to an official
government organization in the United States.
Secure .gov websites use HTTPS
A lock (
) or https:// means you've safely
connected to the .gov website. Share sensitive
information only on official, secure websites.
R0, depending on the environmental pathogen half-life T1/2 and on the uptake rate u. Circles along the diagonal line show the realizations of T1/2 and u used in the simulation experiments (u × T1/2 = 4 × 10⁻⁶), resulting in R0 = 2.259.