Figure 5.

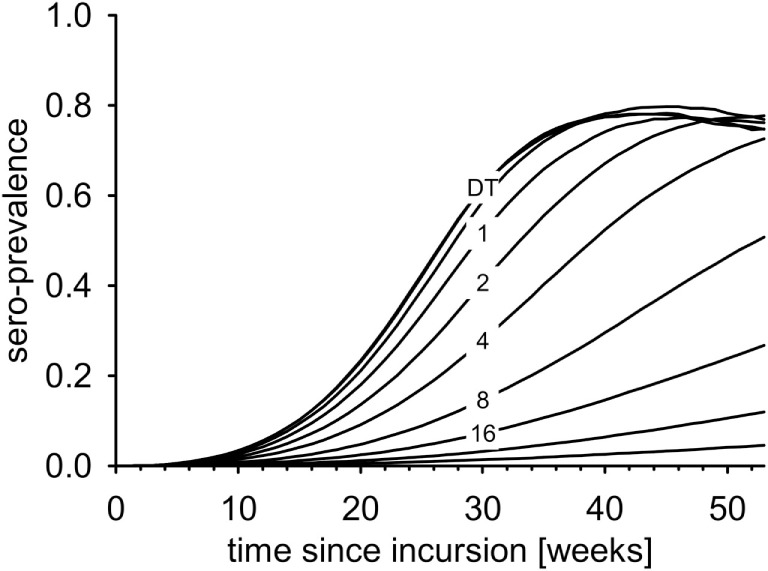
Average seroprevalence over the first year after virus incursion for the DT model and for the IT model with different pathogen half-life (numbers, in days).

Average seroprevalence over the first year after virus incursion for the DT model and for the IT model with different pathogen half-life (numbers, in days).